Gold slips as robust US Retail Sales boost US Dollar and bond yields

- Gold price falls from the intraday high of $2,470 after upbeat US Retail Sales data for July.
- Traders widely anticipatE the Fed will begin reducing interest rates from September.
- The July US CPI data boosted confidence that price pressures will return to the desired 2% rate.
Gold price (XAU/USD) surrenders its intraday gains after rising to near $2,470 in Thursday’s North American session. The precious metal faces pressure as the United States (US) Census Bureau reported that monthly Retail Sales expanded at a faster-than-expected pace in July. The Retail Sales data, a key measure of consumer spendings that drives inflationary pressures, rose strongly by 1%, from expectations of 0.3%. Sales at retail stores were contracted in June by 0.2%, downwardly revised from a flat performance.
Though US Retail Sales remained robust due to strong demand for automobiles, they are less likely to impact firm speculation that the Federal Reserve (Fed) will begin reducing interest rates from the September meeting but have dampened expectations for big rate cuts. Meanwhile, strong Retail Sales growth has prompted a sharp recovery in both the US Dollar (USD) and bond yields.
The US Dollar Index (DXY), which tracks the Greenback’s value against six major currencies, jumps almost 0.5% above the crucial resistance of 103.00. 10-year US Treasury yields soar to near 3.94%. Usually, higher yields on interest-bearing assets bode poorly for non-yielding assets such as Gold, given that they increase the opportunity cost of holding an investment in them.
Meanwhile, surprisingly lower Initial Jobless Claims for the week ending August 9 have also strengthened the US Dollar and bond yields. Individuals claiming jobless benefits for the first time came in lower at 227K than estimates of 235K and the prior release of 234K, upwardly revised from 233K.
Daily digest market movers: Gold price drops as US Dollar and bond yields bounce back strongly
- Gold price gives up its intraday gains after the release of strong Retail Sales data for July. However, its near-term outlook remains firm as investors seem to be increasingly confident that the restrictive monetary policy stance by the Fed, maintained for more than two years, will start to be unwound in September.
- The United States (US) Consumer Price Index (CPI) report for July, released on Wednesday, added to evidence that price growth is on track to return to the desired rate of 2%. Annual headline inflation decelerated to 2.9% from expectations and June’s reading of 3%. In the same period, the core CPI, which excludes volatile food and energy prices, grew by 3.2% as expected, down from the prior release of 3.3%.
- Though the CPI report showed that price pressures eased on year, month-on-month headline and core inflation rose by 0.2% as expected. The rise, which was driven mainly by higher rentals and prices of transportation services, dampened speculation for Fed big rate cuts ahead.
- According to the CME FedWatch tool, 30-day Federal Funds Futures pricing data shows that traders see a 25.5% chance that interest rates will be reduced by 50 basis points (bps) in September, down significantly from the 55% recorded a week ago.
- However, Atlanta Fed Bank President Raphael Bostic appeared comfortable with a 50 bps interest-rate reduction if the labor market weakens further, he said in an interview with the Financial Times (FT) on Wednesday. Bostic added that he is open to interest rate cuts in September and warned that the Fed can’t “afford to be late” to ease monetary policy, Reuters reported.
US Dollar Price Today:
US Dollar PRICE Today
The table below shows the percentage change of US Dollar (USD) against listed major currencies today. US Dollar was the strongest against the Japanese Yen.
| USD | EUR | GBP | JPY | CAD | AUD | NZD | CHF | |
|---|---|---|---|---|---|---|---|---|
| USD | 0.35% | -0.13% | 1.01% | -0.04% | -0.32% | 0.08% | 0.54% | |
| EUR | -0.35% | -0.49% | 0.65% | -0.39% | -0.75% | -0.44% | 0.20% | |
| GBP | 0.13% | 0.49% | 1.13% | 0.10% | -0.25% | 0.06% | 0.78% | |
| JPY | -1.01% | -0.65% | -1.13% | -1.05% | -1.33% | -1.05% | -0.36% | |
| CAD | 0.04% | 0.39% | -0.10% | 1.05% | -0.28% | -0.04% | 0.68% | |
| AUD | 0.32% | 0.75% | 0.25% | 1.33% | 0.28% | 0.31% | 1.02% | |
| NZD | -0.08% | 0.44% | -0.06% | 1.05% | 0.04% | -0.31% | 0.72% | |
| CHF | -0.54% | -0.20% | -0.78% | 0.36% | -0.68% | -1.02% | -0.72% |
The heat map shows percentage changes of major currencies against each other. The base currency is picked from the left column, while the quote currency is picked from the top row. For example, if you pick the US Dollar from the left column and move along the horizontal line to the Japanese Yen, the percentage change displayed in the box will represent USD (base)/JPY (quote).
Technical Forecast: Gold price fails to revisit all-time-highs
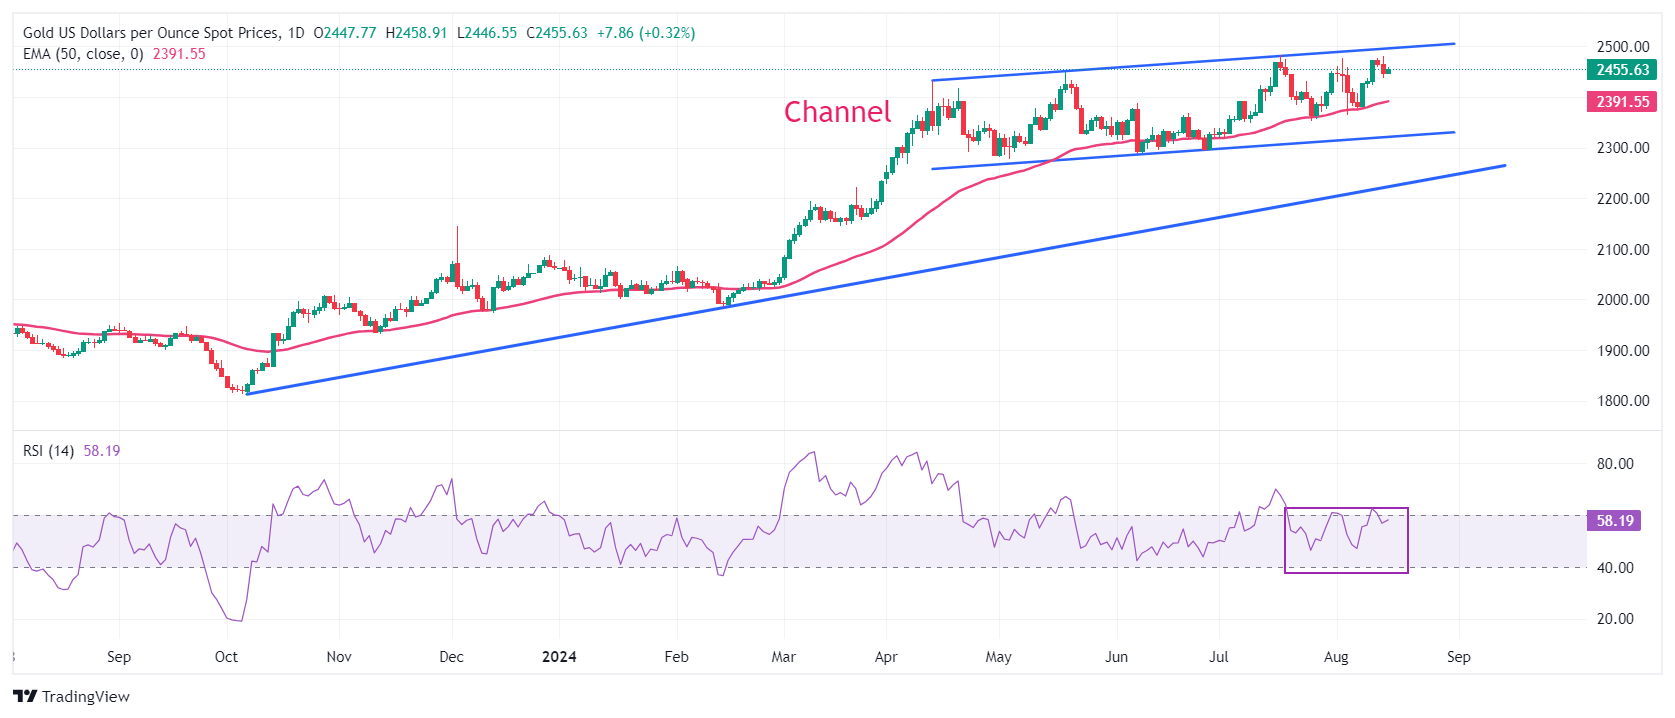
Gold price trades in a channel formation on a daily time frame, which is slightly rising but has been broadly moving sideways for more than three months. The 50-day Exponential Moving Average (EMA) near $2,390 continues to provide support to the Gold price bulls.
The 14-day Relative Strength Index (RSI) oscillates inside the 40.00-60.00 range, suggesting indecisiveness among market participants.
A fresh upside move would appear if the Gold price breaks above its all-time high of $2,483.75, sending it into unchartered territory.
On the downside, the upward-sloping trendline at $2,225, plotted from the October 6, 2023, low near $1,810.50, will be a major support in the longer term.
