EUR/USD Price Forecast: Seems poised to surpass 1.1000 mark and retest YTD peak

- EUR/USD regains positive traction on Friday amid the emergence of some USD selling.
- Fed rate cut bets, along with a positive risk tone, undermine the safe-haven Greenback.
- The technical setup favors bulls and supports prospects for a further appreciating move.
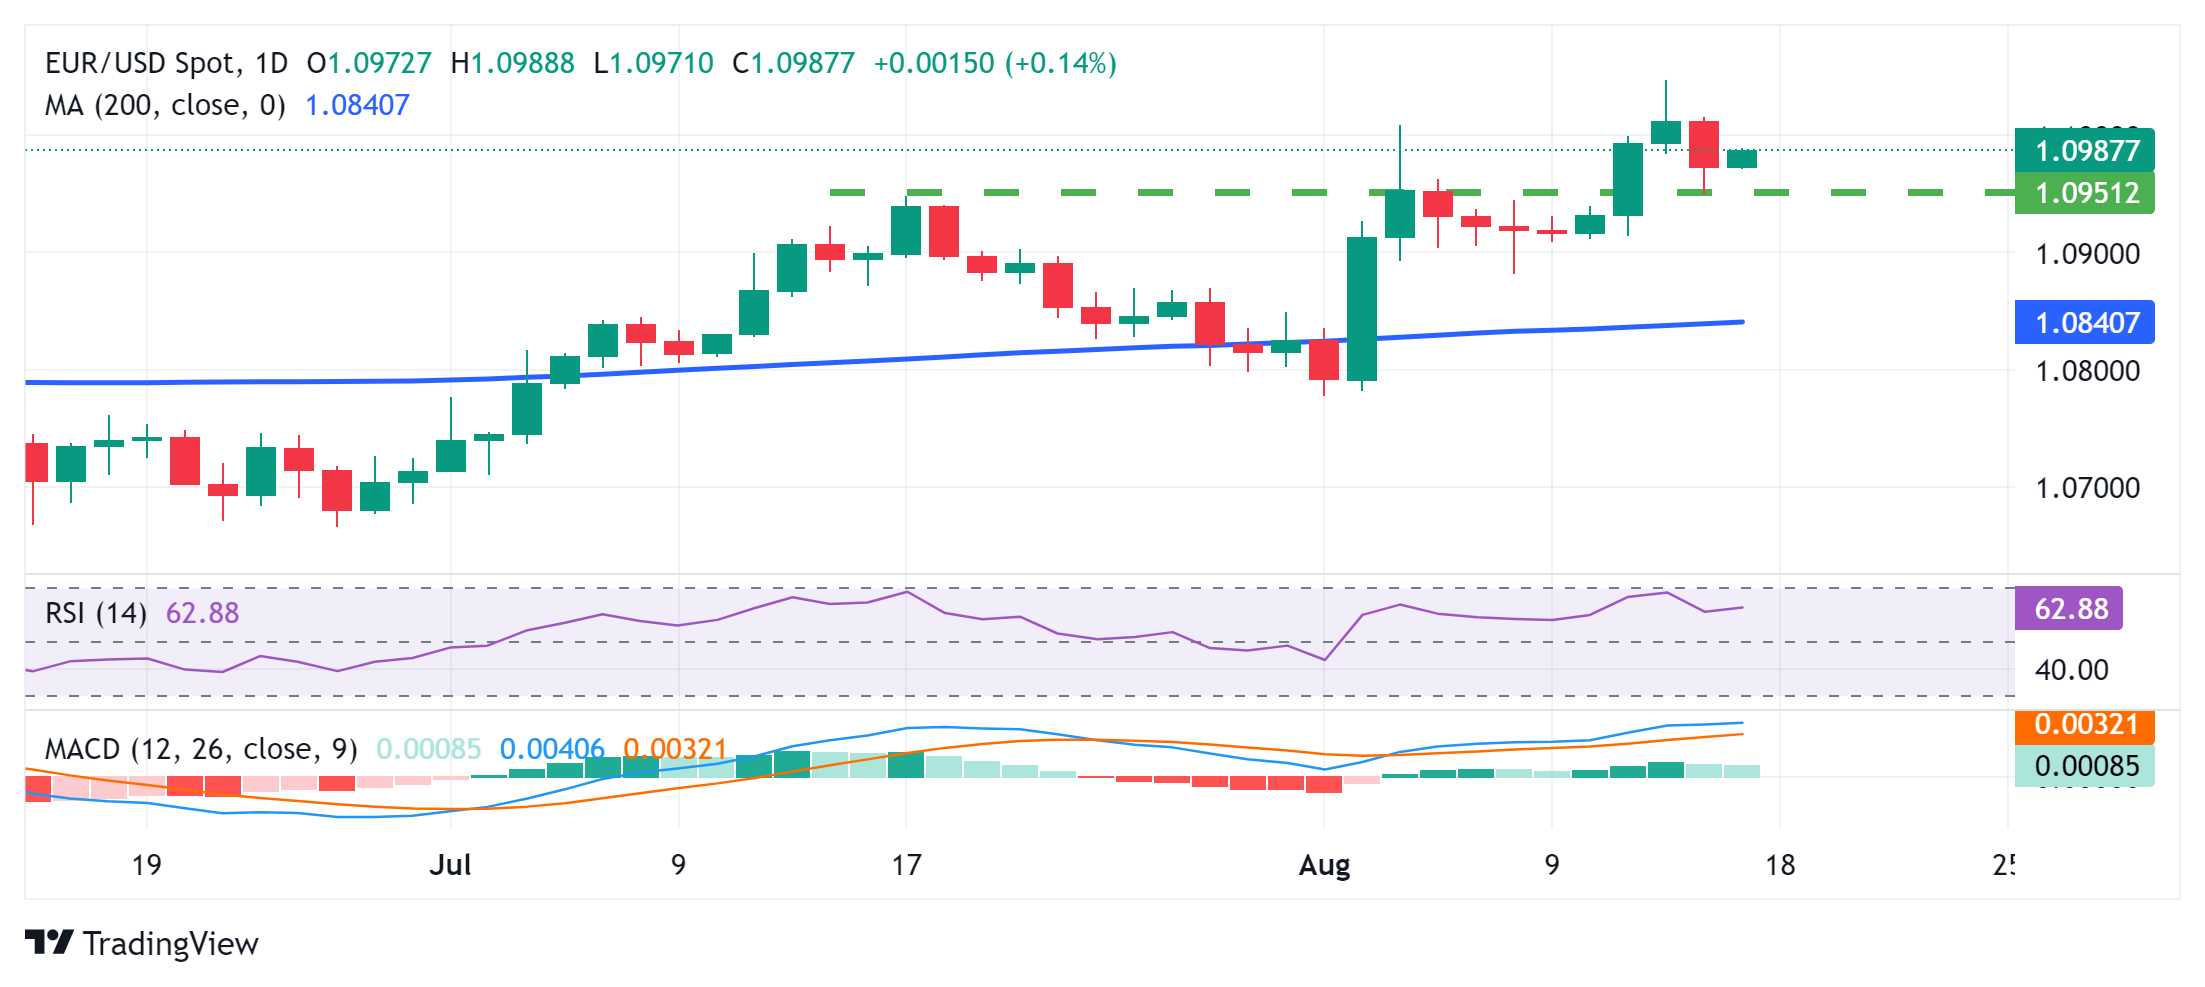
The EUR/USD pair builds on the overnight bounce from the 1.0950 area and gains some follow-through traction on Friday, albeit seems to lack bullish conviction. Spot prices stick to modest intraday gains through the early part of the European session and currently trade around the 1.0985 region, up just over 0.10% for the day.
The US Dollar (USD) struggles to capitalize on Thursday’s upbeat US macro data-inspired positive move amid expectations that the Federal Reserve (Fed) will start its rate-cutting cycle in September. Apart from this, a positive tone across the global equity markets undermines the safe-haven Greenback, which, in turn, is seen lending some support to the EUR/USD pair.
From a technical perspective, Thursday’s late rebound from the 1.1950 resistance breakpoint, now turned support, favors bullish traders. Moreover, oscillators on the daily chart are holding in positive territory and are still away from being in the overbought zone, suggesting that the path of least resistance for the EUR/USD pair is up and supports prospects for further gains.
Hence, a subsequent strength beyond the 1.1000 psychological mark, towards challenging the YTD peak near the 1.1045-1.1050 region touched on Wednesday, looks like a distinct possibility. Some follow-through buying will be seen as a fresh trigger for bullish traders and pave the way for a move towards reclaiming the 1.1100 mark for the first time since December 2023.
On the flip side, the 1.0950 resistance-turned-support should continue to protect the immediate downside ahead of the 1.0920 horizontal zone and the 1.0900 mark. Some follow-through selling below the 1.0880 mark might expose the 200-day Simple Moving Average (SMA), currently pegged near the 1.0835 region before the EUR/USD pair drops to the 1.0800 mark.
The latter coincides with the 100-day SMA and should act as a key pivotal point. A convincing break below will suggest that spot prices have formed a near-term top and shift the near-term bias in favor of bearish traders.
US Dollar PRICE Today
The table below shows the percentage change of US Dollar (USD) against listed major currencies today. US Dollar was the strongest against the Canadian Dollar.
| USD | EUR | GBP | JPY | CAD | AUD | NZD | CHF | |
|---|---|---|---|---|---|---|---|---|
| USD | -0.13% | -0.20% | -0.27% | -0.05% | -0.27% | -0.39% | -0.41% | |
| EUR | 0.13% | -0.07% | -0.15% | 0.08% | -0.18% | -0.38% | -0.25% | |
| GBP | 0.20% | 0.07% | -0.10% | 0.15% | -0.10% | -0.30% | -0.19% | |
| JPY | 0.27% | 0.15% | 0.10% | 0.28% | -0.01% | -0.23% | -0.14% | |
| CAD | 0.05% | -0.08% | -0.15% | -0.28% | -0.25% | -0.48% | -0.36% | |
| AUD | 0.27% | 0.18% | 0.10% | 0.01% | 0.25% | -0.21% | -0.11% | |
| NZD | 0.39% | 0.38% | 0.30% | 0.23% | 0.48% | 0.21% | 0.12% | |
| CHF | 0.41% | 0.25% | 0.19% | 0.14% | 0.36% | 0.11% | -0.12% |
The heat map shows percentage changes of major currencies against each other. The base currency is picked from the left column, while the quote currency is picked from the top row. For example, if you pick the US Dollar from the left column and move along the horizontal line to the Japanese Yen, the percentage change displayed in the box will represent USD (base)/JPY (quote).
