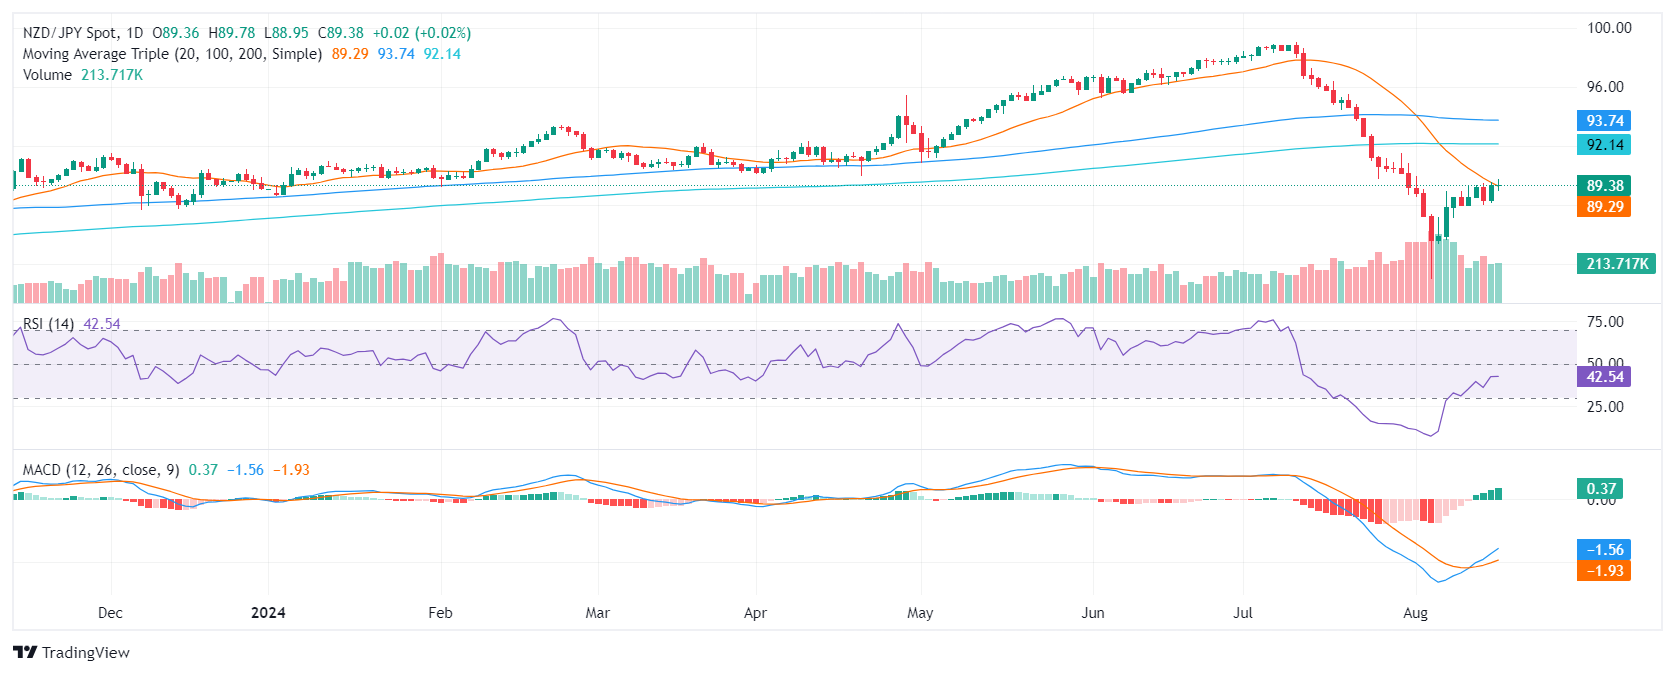
NZD/JPY Price Analysis: Bulls regain some ground, must conquer the 20-day SMA

- NZD/JPY mildly rose to 89.30, testing the 20-day SMA.
- The RSI is near 50 while the MACD shows flat green bars, signaling that the momentum is sideways.
- A jump above the 20-day SMA would confirm a bullish outlook.
The NZD/JPY pair gained ground in Friday’s session, climbing to 89.30. The uptick follows side-ways movements during the week, but the pair could be ready for a change of trend.
The Relative Strength Index (RSI) is hovering near 50, indicating that the pair is near neutral territory. If the RSI can move above 50, it could signal a potential shift in market sentiment. The Moving Average Convergence Divergence (MACD) shows flat green bars, indicating that the momentum is sideways. The positive divergence between the RSI and MACD shows that the selling pressure is being pressured by the buying force and it is possible that, if this holds, the pair can see upside movements in the next sessions.
The NZD/JPY pair has bounced off the support level of 88.50 and is currently challenging the 20-day SMA. If the pair continues to rise, it could find resistance at 0.8970 and 0.9000. On the downside, support can be found at 0.8900, 0.8880, and 0.8840. A sustained break above 0.8970 could signal a continuation of the uptrend, while a break below 0.8840 could signal a continuation of the downtrend. The volume has been declining during the last few sessions, which is a sign of neutrality.
