
Why low volume in S&P 500 could be signaling a hidden opportunity [Video]
Watch the S&P 500 video extracted from the WLGC session before the market opens on 20 Aug 2024 to find out the following:
-
What does the low trading volume in the S&P 500 indicate about current market conditions?
-
What signals might indicate a reversal in the S&P 500’s uptrend?
-
The significance of the “failure bar” in the S&P 500.
-
The key level to watch out for a reversal in the S&P 500.
-
And a lot more…
Market environment
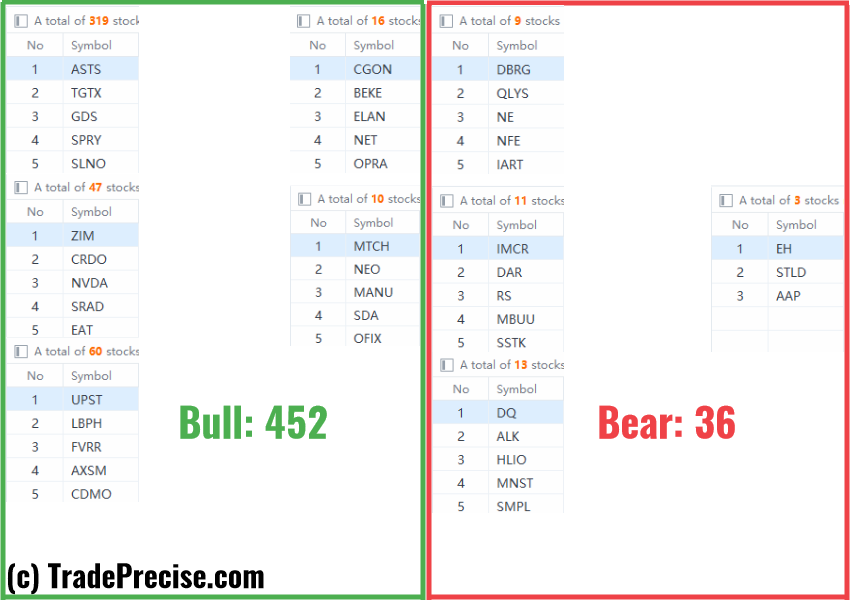
The bullish vs. bearish setup is 452 to 36 from the screenshot of my stock screener below.
Both the long-term and short-term market breadth have improved significantly. However, traders need to pay attention to the low supply rally and the implications as discussed in the video.
Three stocks ready to Soar
22 actionable setups such as CHRW, DYN, RCL were discussed during the live session before the market open (BMO).
The change of character as discussed in the video above suggests the market structure has changed. If I were to trade, I would cut down to 1/2 of the normal position size and use conservative trade management to protect the capital.
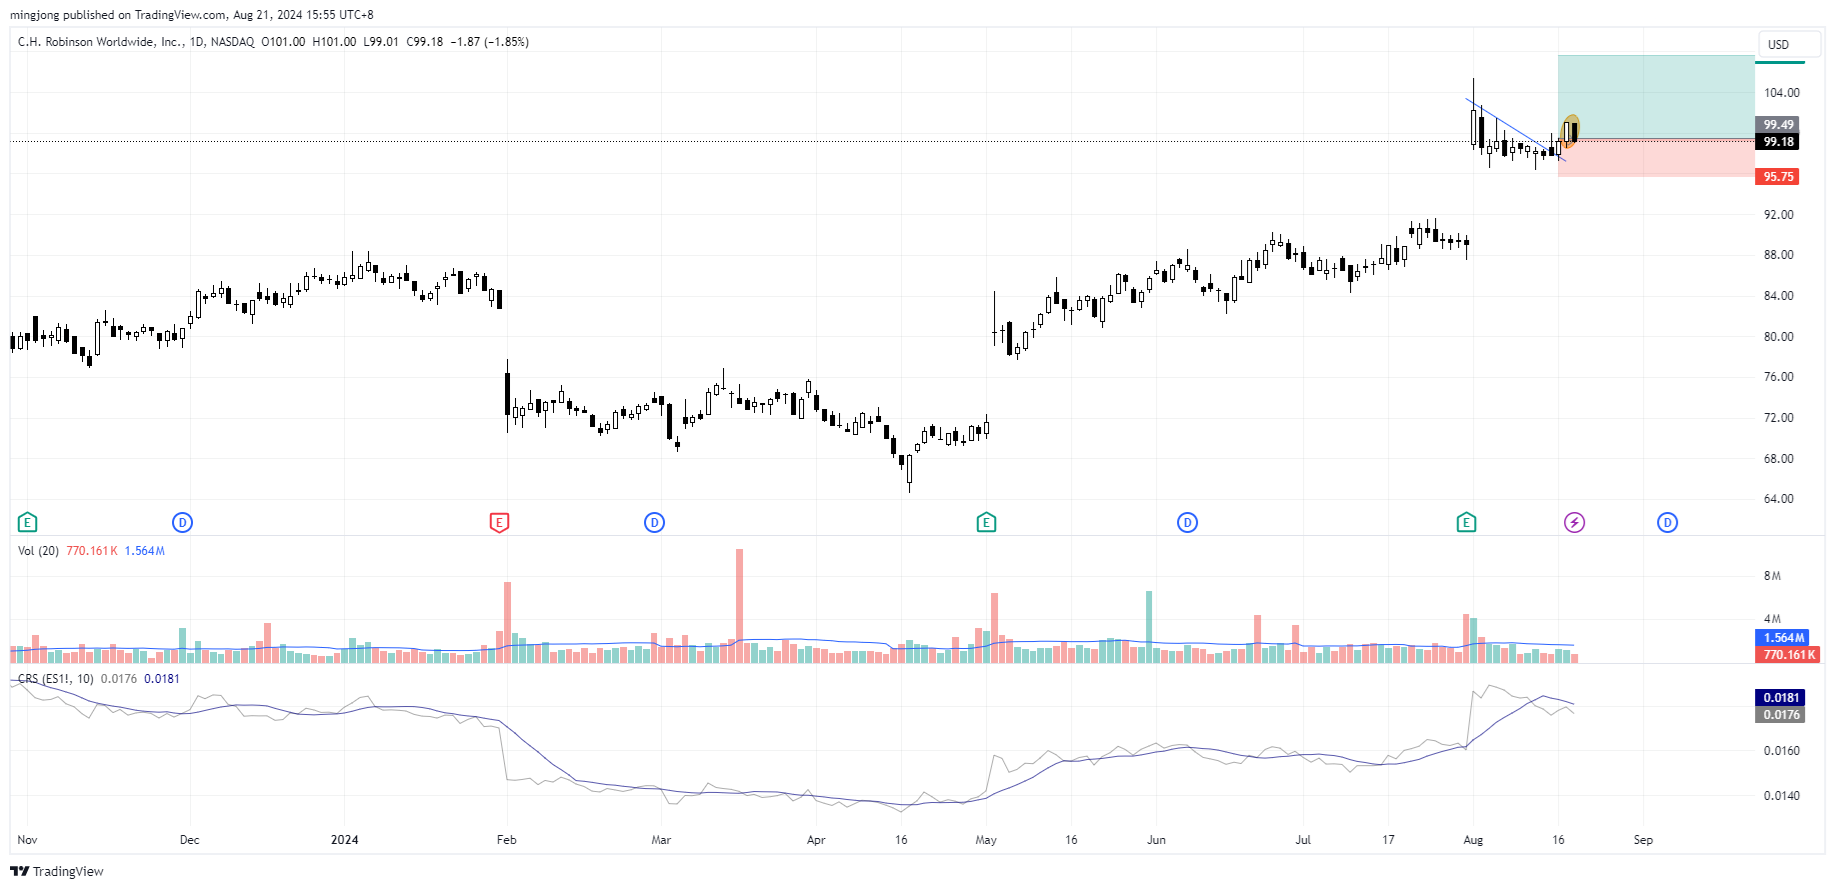
CHRW
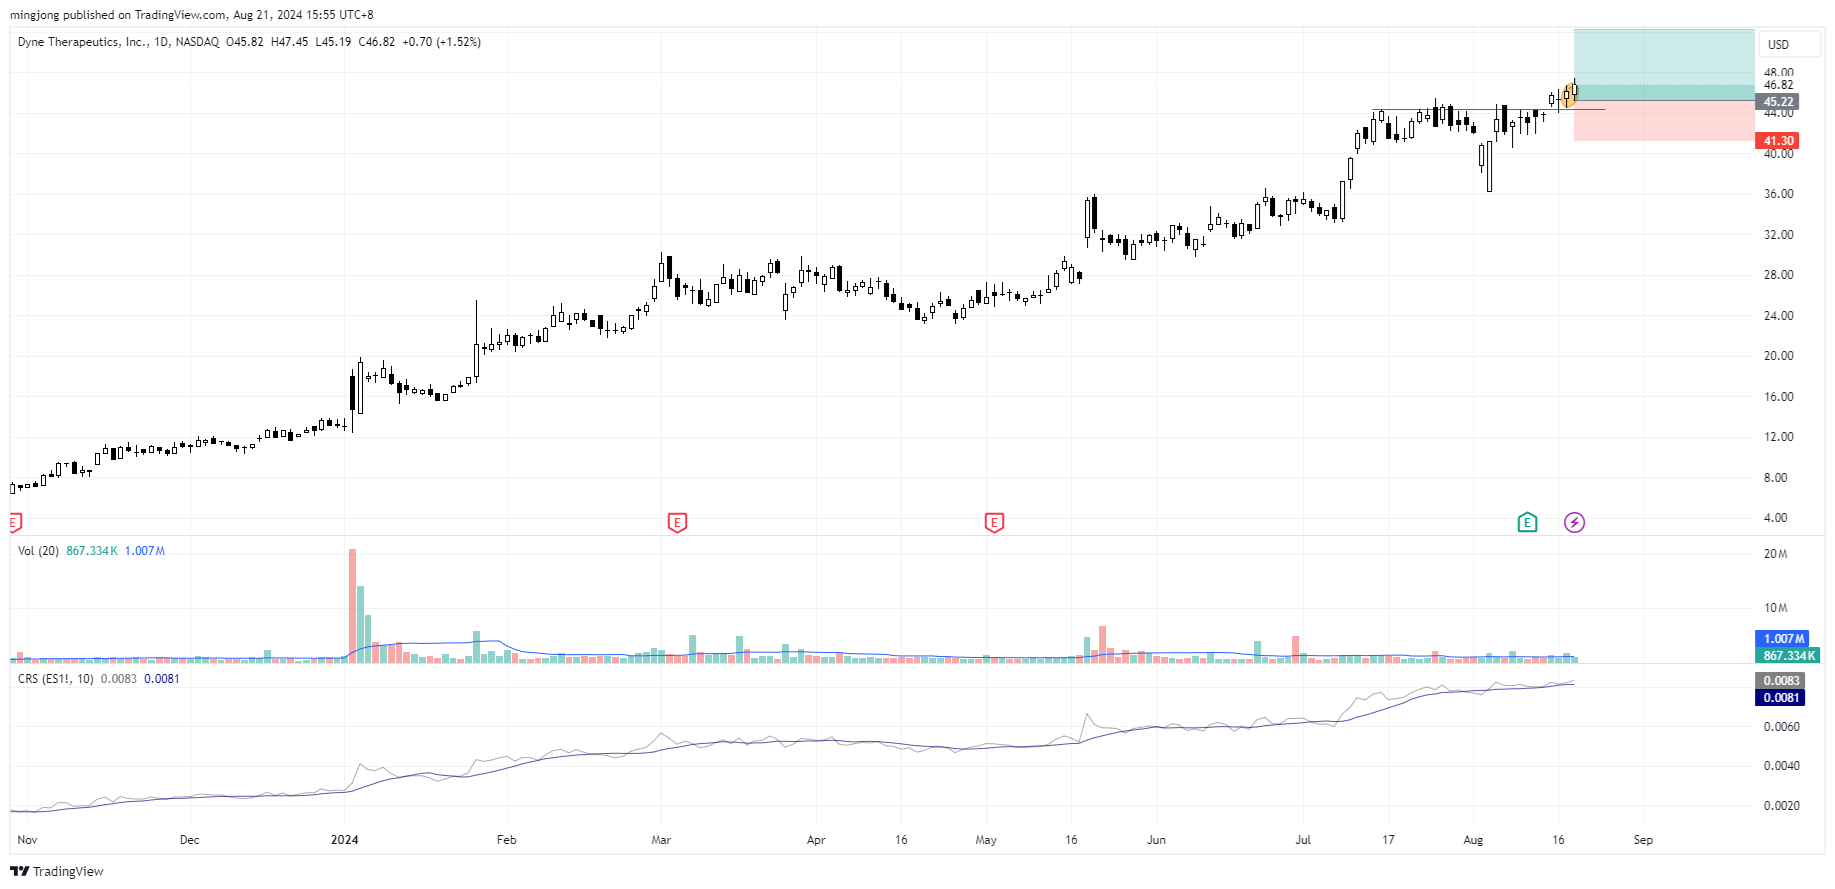
DYN
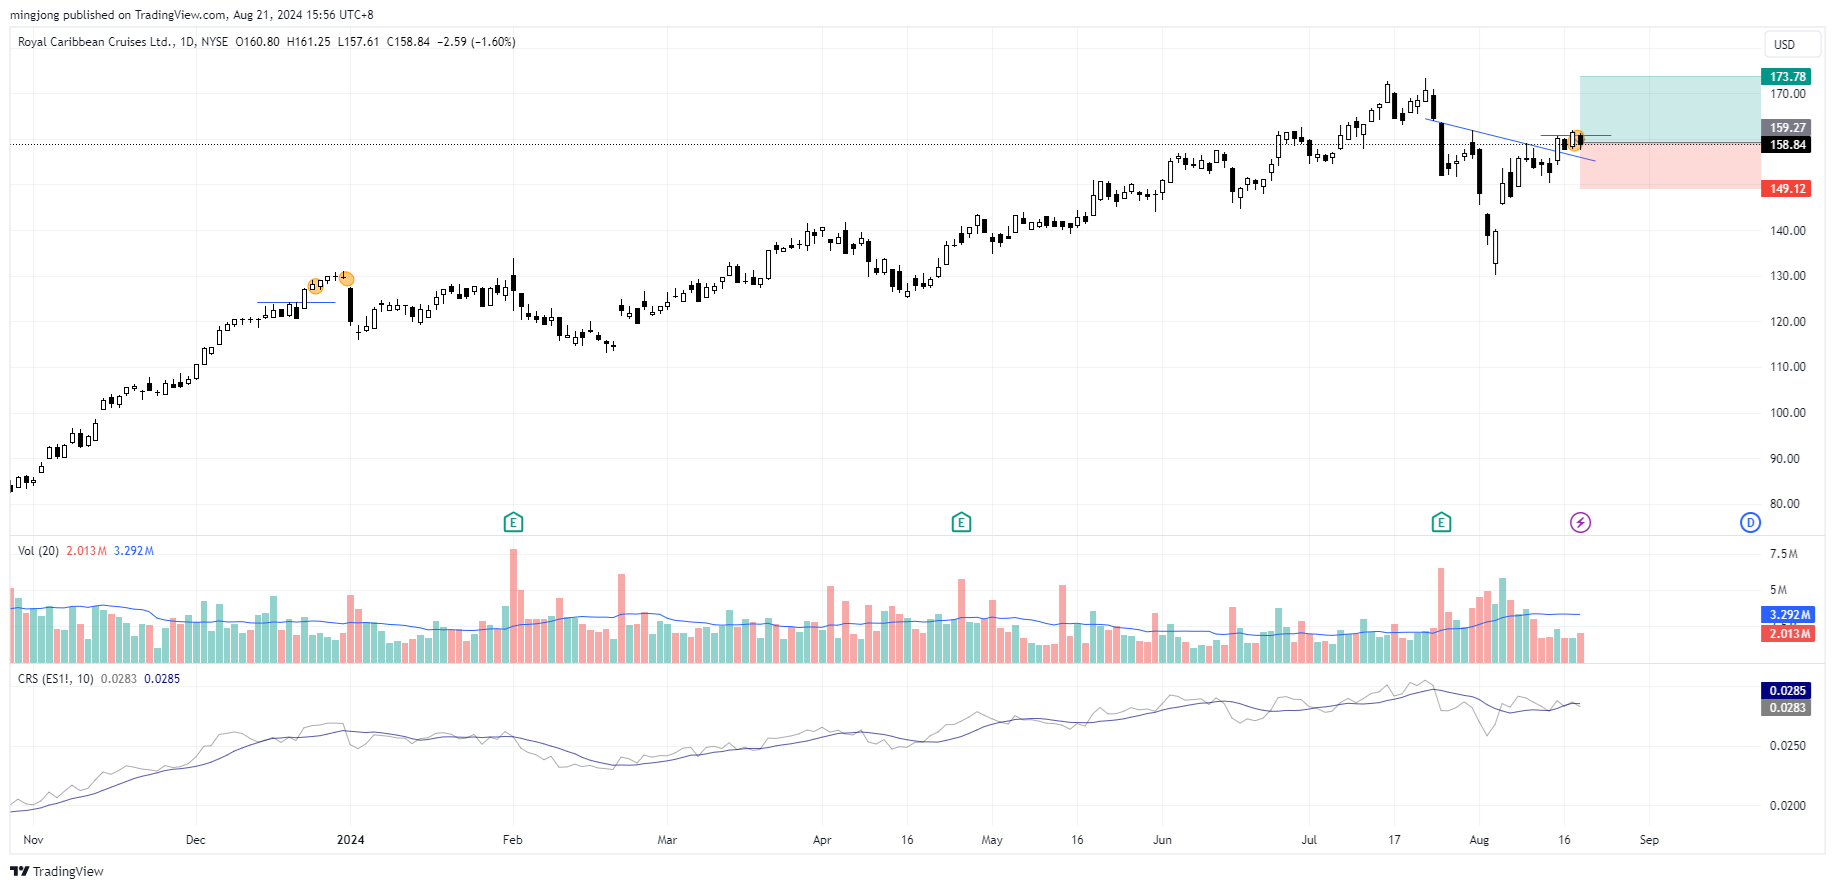
RCL