Advanced Micro Devices Inc. (AMD) Elliott Wave technical analysis [Video]

AMD Elliott Wave technical analysis
Function: Trend.
Mode: Impulsive.
Structure: Motive.
Position: Wave (v).
Direction: Upside in wave (v).
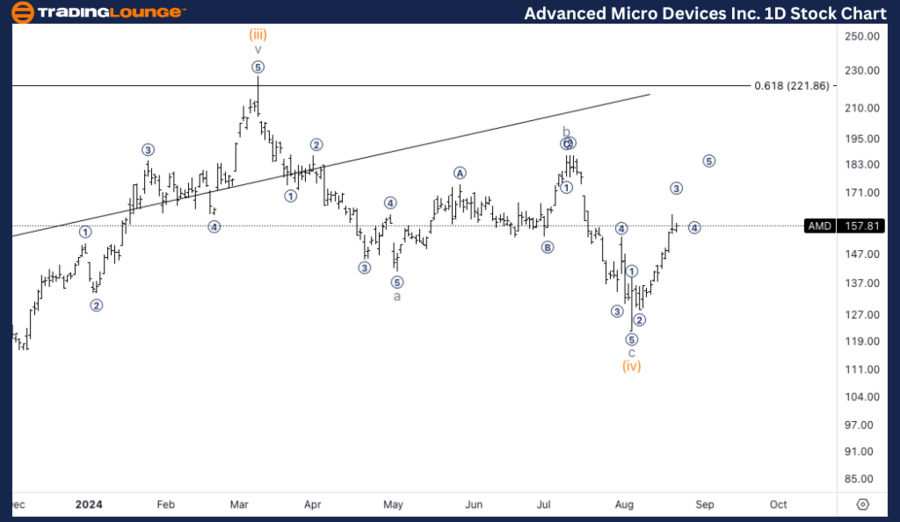
Details: We are looking at a three wave move into what appears to be minuette wave (iv), especially as we keep finding support on top of 150$.
AMD Elliott Wave technical analysis – Daily chart
AMD appears to be progressing into wave (v), the final wave of the current impulsive sequence. The recent price movements suggest a three-wave correction into what is likely minuette wave (iv). Importantly, AMD has repeatedly found support around the $150 level, which reinforces the likelihood of continued upward momentum. The market structure indicates that wave (v) could extend further, with $180 being a possible target as the wave unfolds.
AMD Elliott Wave technical analysis
Function: Trend.
Mode: Impulsive.
Structure: Motive.
Position: Micro wave 4 of i.
Direction: Upside into micro wave 5.
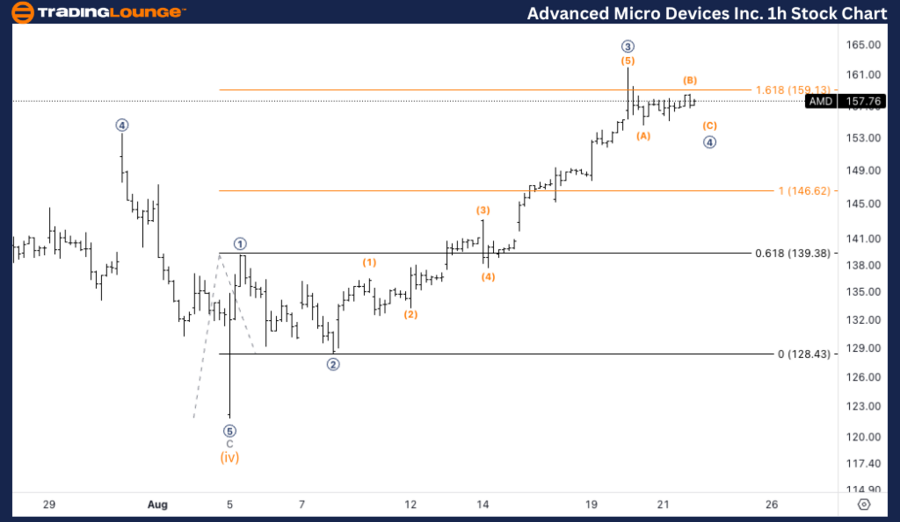
Details: Looking for completion of micro wave 4, as we have hit 1.618 3 vs. 1 at 159$. Looking for a top in micro wave 5 at ideally 180$.
AMD Elliott Wave technical analysis – One-hour chart
AMD is in the process of completing micro wave 4, with price action having hit the 1.618 Fibonacci extension of wave 3 vs. 1 at $159. This level acts as a significant resistance area, but the current wave structure suggests that micro wave 5 could push the price towards $180, which is the anticipated top for this micro wave sequence.
Welcome to our latest Elliott Wave analysis for Advanced Micro Devices Inc. (AMD). This report provides a thorough examination of AMD’s price action through Elliott Wave Theory, offering traders insights into potential market opportunities. We’ll review both the daily and 1-hour charts to give you a comprehensive understanding of AMD’s current market behavior.

