
GBP/USD Price Forecast: Battles key 1.3210 resistance on the road to recovery
- GBP/USD is on a gradual recovery mode, as the US Dollar resumes the downside.
- The focus now shifts to the US Q2 GDP data for fresh trading impetus in GBP/USD.
- The Pound Sterling looks bullish against the US Dollar on the four-hour chart.
GBP/USD is making a headway back toward the 29-month high set on Tuesday at 1.3266. The pair is helped by a renewed selling seen in the US Dollar even as risk-off flows dominate, in the aftermath of the disappointing guidance shared by the American AI titan, Nvidia.
The divergent monetary policy outlooks between the US Federal Reserve (Fed) and the Bank of England (BoE) also remain in favor of the GBP/USD uptrend.
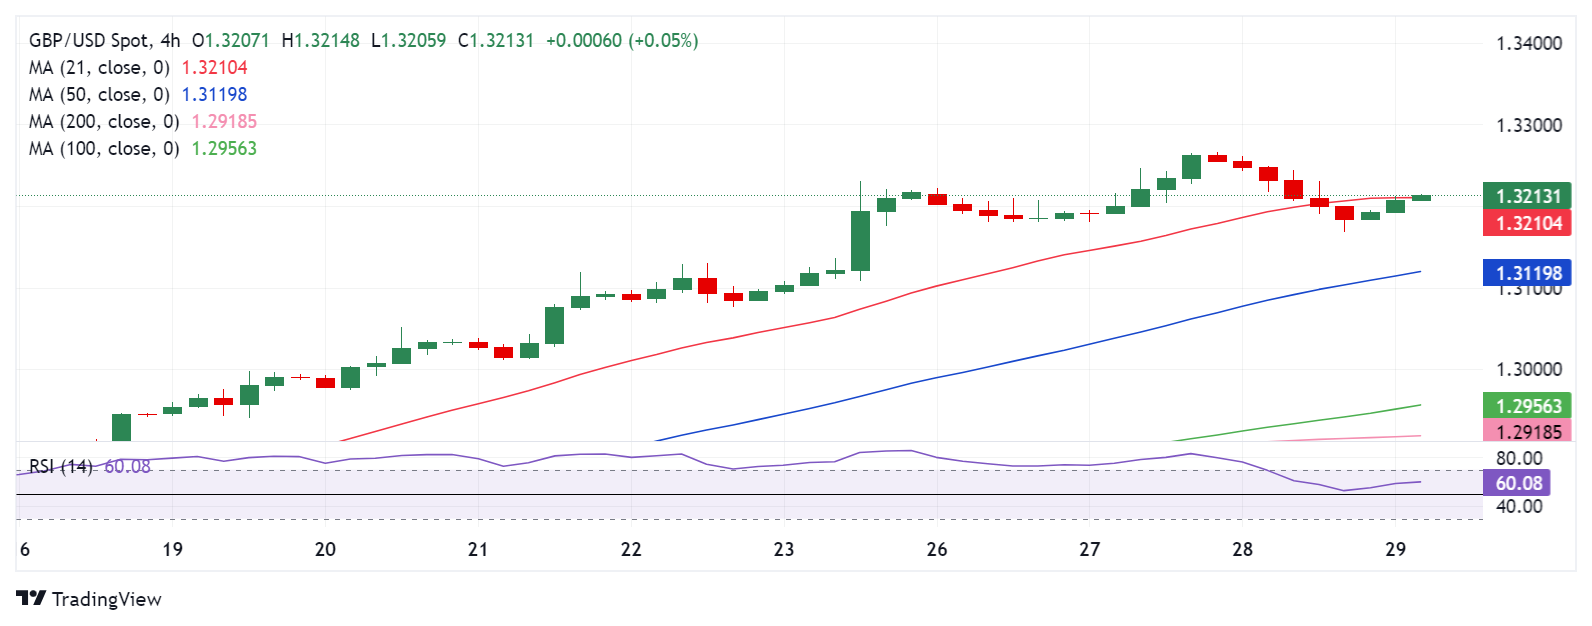
However, the further upside in the pair remains at the mercy of the upcoming second estimate of the US Q2 Gross Domestic Product (GDP) and the acceptance above the 21-Simple Moving Average (SMA) on the four-hour chart.
The 21-day SMA aligns at 1.3210, where it now wavers. Recapturing the latter is necessary on a four-hourly candlestick closing basis to take on the 1.3250 psychological level.
Fresh buyers will likely emerge above that level, calling for the test of the two-year high of 1.3266 en route to the 1.3300 round figure.
Conversely, a failure to gain a strong foothold above the 21-SMA, sellers will jump back into the game, dragging GBP/USD back toward the 50-SMA at 1.3120.
The Relative Strength Index (RSI), however, points north near 60, suggesting that the recovery mode could extend.
GBP/USD: Daily chart
British Pound PRICE Today
The table below shows the percentage change of British Pound (GBP) against listed major currencies today. British Pound was the strongest against the Japanese Yen.
| USD | EUR | GBP | JPY | CAD | AUD | NZD | CHF | |
|---|---|---|---|---|---|---|---|---|
| USD | -0.15% | -0.16% | 0.10% | -0.15% | -0.29% | -0.79% | -0.24% | |
| EUR | 0.15% | -0.02% | 0.24% | -0.02% | -0.15% | -0.64% | -0.07% | |
| GBP | 0.16% | 0.02% | 0.27% | 0.00% | -0.12% | -0.61% | -0.02% | |
| JPY | -0.10% | -0.24% | -0.27% | -0.23% | -0.39% | -0.91% | -0.30% | |
| CAD | 0.15% | 0.02% | -0.01% | 0.23% | -0.13% | -0.64% | -0.04% | |
| AUD | 0.29% | 0.15% | 0.12% | 0.39% | 0.13% | -0.48% | 0.13% | |
| NZD | 0.79% | 0.64% | 0.61% | 0.91% | 0.64% | 0.48% | 0.59% | |
| CHF | 0.24% | 0.07% | 0.02% | 0.30% | 0.04% | -0.13% | -0.59% |
The heat map shows percentage changes of major currencies against each other. The base currency is picked from the left column, while the quote currency is picked from the top row. For example, if you pick the British Pound from the left column and move along the horizontal line to the US Dollar, the percentage change displayed in the box will represent GBP (base)/USD (quote).