
USD/INR remains firm, Indian PMI hits three-month low of 57.5
- The Indian Rupee loses momentum, snapping the two-day winning streak in Monday’s early European session.
- The Indian August HSBC Manufacturing PMI came in at 57.5 vs. 57.9 prior, weaker than expected.
- USD demand weighs on the INR, while foreign equity inflows and lower crude oil prices could underpin the local currency.
The Indian Rupee (INR) drifts lower on the stronger US Dollar (USD) on Monday. The INR was the second-worst-performing Asian currency in August, pressured by strong USD from state-run banks. The latest data released on Monday showed that the HSBC India Manufacturing Purchasing Managers Index (PMI) eased to 57.5 in August. This figure was below the market consensus and the previous reading of 57.9. The local currency remains weak in an immediate reaction to the downbeat PMI data. However, the downside might be limited amid likely inflows into local equities and a further decline in crude oil prices.
Investors await the US ISM Manufacturing PMI for August, which is due on Tuesday. The US Nonfarm Payrolls (NFP) will be closely watched on Friday. This data might offer some cues about the size and pace of the Federal Reserve (Fed) interest rate cuts. Another weaker reading might exert some selling pressure on the USD.
Daily Digest Market Movers: Indian Rupee weakens amid the renewed USD demand
- “The rupee depreciated by 0.2 percent in August to currently trade at 83.87 per dollar, close to its lifetime low of 83.97 per dollar. This was despite the weakening of the US dollar. The factors that impacted the rupee are a slowdown in FPI inflows (mainly the equity segment), and increased dollar demand by importers. In contrast to most global currencies, which rose against the dollar, the rupee declined,” noted Sonal Badhan, economist at Bank of Baroda.
- India’s economic growth slowed to a 15-month low of 6.7% in the April-June quarter, according to data released by the statistics ministry on Friday. This follows a 7.8% expansion in the previous quarter.
- The US Personal Consumption Expenditures (PCE) Price Index rose 0.2% MoM in July, matching the market expectation, the Commerce Department reported on Friday. On a yearly basis, the PCE inflation remained unchanged at 2.5% in July.
- The core PCE, excluding volatile food and energy prices, increased 0.2% for the month but rose 2.6% from a year ago. The annual figure was slightly softer than the 2.7% expected.
- Traders slightly raised bets of a 25 basis points (bps) rate cut by the Fed in September to around 70%, with a 50 bps reduction possibility standing at 30% following the PCE inflation report, according to the CME FedWatch tool.
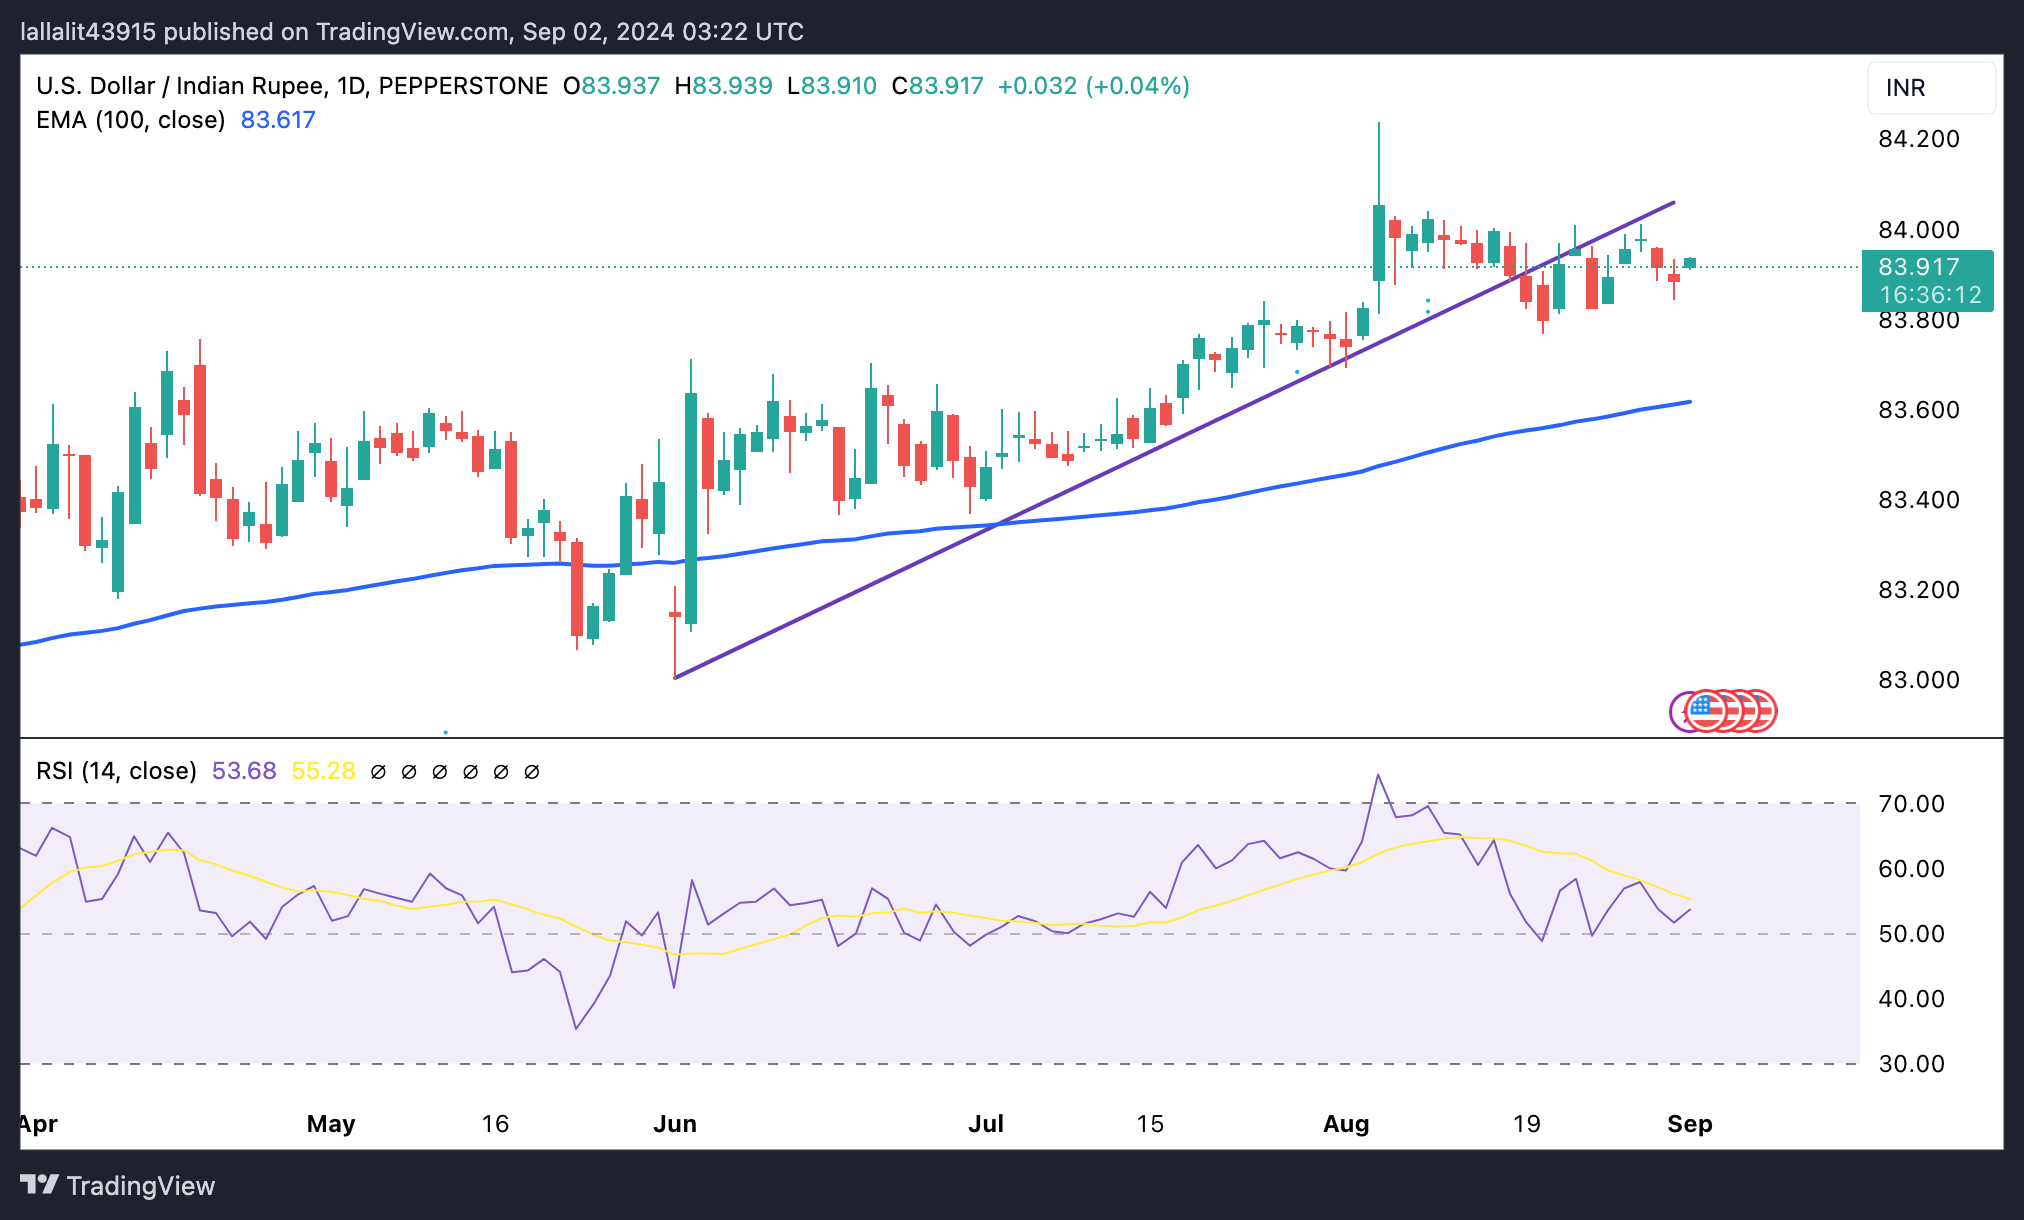
Technical Analysis: USD/INR’s longer-term outlook points to bullish momentum
The Indian Rupee trades on a weaker note on the day. The USD/INR remains capped under the 84.00 barrier. However, the positive view of the USD/INR remains in play as the pair is well-supported above the key 100-day Exponential Moving Average (EMA) on the daily chart. The 14-day Relative Strength Index (RSI) holds in the bullish zone near 54.50, indicating the overall momentum is strongly in favor of the bulls.
The crucial upside barrier for USD/INR is located at the 84.00 round figure. Extended gains will attract some buyers to 84.50.
On the other hand, the low of August 20 at 83.77 acts as an initial support level for the pair. Any follow-through selling will see a drop to the 100-day EMA at 83.61.
US Dollar price this week
The table below shows the percentage change of US Dollar (USD) against listed major currencies this week. US Dollar was the strongest against the New Zealand Dollar.
| USD | EUR | GBP | CAD | AUD | JPY | NZD | CHF | |
| USD | -0.02% | 0.01% | 0.05% | 0.05% | -0.22% | 0.20% | -0.05% | |
| EUR | 0.02% | 0.04% | 0.06% | 0.08% | -0.21% | 0.19% | -0.03% | |
| GBP | -0.01% | -0.05% | 0.03% | 0.05% | -0.25% | 0.19% | -0.07% | |
| CAD | -0.06% | -0.06% | -0.02% | 0.01% | -0.29% | 0.15% | -0.10% | |
| AUD | -0.05% | -0.08% | -0.04% | -0.02% | -0.30% | 0.12% | -0.09% | |
| JPY | 0.24% | 0.22% | 0.25% | 0.31% | 0.30% | 0.42% | 0.18% | |
| NZD | -0.20% | -0.22% | -0.18% | -0.15% | -0.13% | -0.44% | -0.25% | |
| CHF | 0.05% | 0.01% | 0.07% | 0.10% | 0.11% | -0.19% | 0.24% |
The heat map shows percentage changes of major currencies against each other. The base currency is picked from the left column, while the quote currency is picked from the top row. For example, if you pick the Euro from the left column and move along the horizontal line to the Japanese Yen, the percentage change displayed in the box will represent EUR (base)/JPY (quote).