
Australian Dollar depreciates due to increasing risk aversion
- The Australian Dollar declines as the US Dollar advances due to improved Treasury yields.
- The downside of the AUD/USD pair could be limited as dovish sentiment surrounds the Fed.
- The US Dollar may face challenges on rising odds of a 25 basis point rate cut by the Fed.
The Australian Dollar (AUD) edges lower against the US Dollar (USD) as traders await the ISM Manufacturing PMI data due on Tuesday. However, the AUD/USD pair may find some support amid increasing dovish expectations regarding the US Federal Reserve’s (Fed) policy outlook.
Traders are now focusing on Australia’s Q2 Gross Domestic Product (GDP) and July Trade Balance data, as well as an upcoming speech by Reserve Bank of Australia (RBA) Governor Michele Bullock later in the week, to gather more insights into the central bank’s hawkish stance on monetary policy.
The US Dollar strengthens as Treasury yields continue to rise, but gains may be limited by growing expectations of a 25 basis point rate cut by the Fed in September. Traders will turn their attention to upcoming US employment data, particularly the August Nonfarm Payrolls (NFP), for further insights into the potential timing and scale of Fed rate cuts.
Daily Digest Market Movers: Australian Dollar declines despite the hawkish RBA
- Australia’s Building Permits surged by 10.4% month-over-month in July, sharply rebounding from a 6.5% decline in June, marking the strongest growth since May 2023. On an annual basis, the growth rate reached 14.3%, a significant recovery from the previous 3.7% decline.
- China’s Caixin Manufacturing PMI rose to 50.4 in August, up from 49.8 in July, which is particularly noteworthy given China’s close trade relationship with Australia.
- The US Bureau of Economic Analysis reported on Friday that the headline Personal Consumption Expenditures (PCE) Price Index increased by 2.5% year-over-year in July, matching the previous reading of 2.5% but falling short of the estimated 2.6%. Meanwhile, the core PCE, which excludes volatile food and energy prices, rose by 2.6% year-over-year in July, consistent with the prior figure of 2.6% but slightly below the consensus forecast of 2.7%.
- The US Gross Domestic Product (GDP) grew at an annualized rate of 3.0% in the second quarter, exceeding both the expected and previous growth rate of 2.8%. Additionally, Initial Jobless Claims showed that the number of people filing for unemployment benefits fell to 231,000 for the week ending August 23, down from the previous 233,000 and slightly below the expected 232,000.
- Australia’s Private Capital Expenditure unexpectedly declined by 2.2% in the second quarter, reversing from an upwardly revised 1.9% expansion in the previous period and falling short of market expectations for a 1.0% increase. This marks the first contraction in new capital expenditure since the third quarter of 2023.
- Australia’s Monthly Consumer Price Index (CPI) increased by 3.5% year-on-year in July, down from June’s 3.8% but slightly above the market consensus of 3.4%. Despite the slight decrease, this marks the lowest CPI figure since March.
- Federal Reserve Atlanta President Raphael Bostic, a prominent hawk on the FOMC, indicated last week that it might be “time to move” on rate cuts due to further cooling inflation and a higher-than-expected unemployment rate. FXStreet’s FedTracker, which gauges the tone of Fed officials’ speeches on a dovish-to-hawkish scale from 0 to 10 using a custom AI model, rated Bostic’s words as neutral with a score of 5.6.
Technical Analysis: Australian Dollar remains above 0.6750
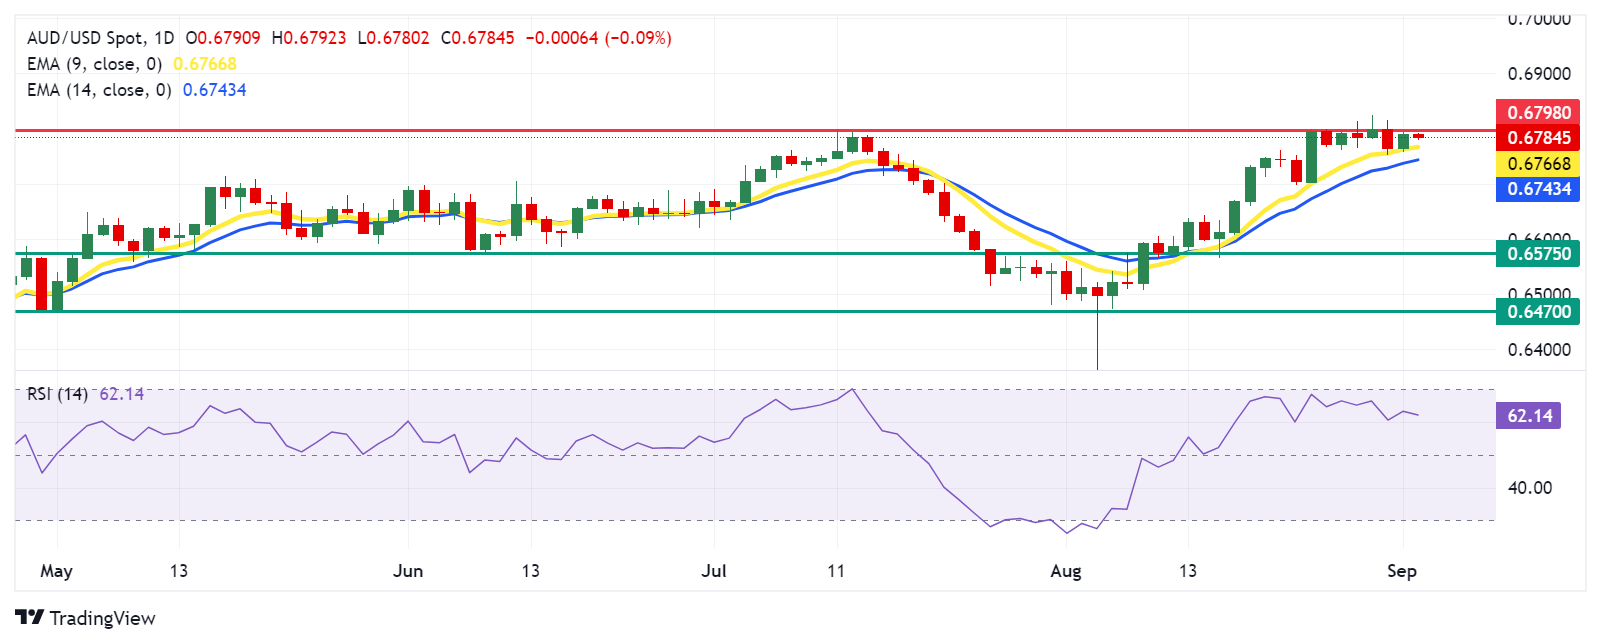
The Australian Dollar trades around 0.6780 on Tuesday. Analyzing the daily chart, the AUD/USD pair is positioned above the nine-day Exponential Moving Average (EMA), suggesting a short-term bullish trend. Additionally, the 14-day Relative Strength Index (RSI) remains above the 50 level, reinforcing the overall bullish trend.
In terms of resistance, the AUD/USD pair may challenge the immediate barrier at the seven-month high of 0.6798. A break above this level could strengthen the ongoing bullish momentum, potentially pushing the pair toward the psychological level of 0.6900.
On the downside, the AUD/USD pair may test immediate support around the nine-day EMA at 0.6767, followed by the 14-day EMA at 0.6743. A break below these EMAs could weaken the bullish bias and increase downward pressure, potentially driving the pair toward the throwback level at 0.6575, with further decline possibly targeting the lower support at 0.6470.
AUD/USD: Daily Chart
Australian Dollar PRICE Today
The table below shows the percentage change of Australian Dollar (AUD) against listed major currencies today. Australian Dollar was the weakest against the Japanese Yen.
| USD | EUR | GBP | JPY | CAD | AUD | NZD | CHF | |
|---|---|---|---|---|---|---|---|---|
| USD | 0.04% | 0.04% | -0.19% | 0.09% | 0.26% | 0.34% | 0.12% | |
| EUR | -0.04% | -0.00% | -0.23% | 0.05% | 0.21% | 0.20% | 0.07% | |
| GBP | -0.04% | 0.00% | -0.23% | 0.05% | 0.21% | 0.20% | 0.08% | |
| JPY | 0.19% | 0.23% | 0.23% | 0.27% | 0.44% | 0.33% | 0.29% | |
| CAD | -0.09% | -0.05% | -0.05% | -0.27% | 0.14% | 0.06% | 0.03% | |
| AUD | -0.26% | -0.21% | -0.21% | -0.44% | -0.14% | -0.12% | -0.14% | |
| NZD | -0.34% | -0.20% | -0.20% | -0.33% | -0.06% | 0.12% | -0.02% | |
| CHF | -0.12% | -0.07% | -0.08% | -0.29% | -0.03% | 0.14% | 0.02% |
The heat map shows percentage changes of major currencies against each other. The base currency is picked from the left column, while the quote currency is picked from the top row. For example, if you pick the Australian Dollar from the left column and move along the horizontal line to the US Dollar, the percentage change displayed in the box will represent AUD (base)/USD (quote).
Economic Indicator
ISM Manufacturing PMI
The Institute for Supply Management (ISM) Manufacturing Purchasing Managers Index (PMI), released on a monthly basis, is a leading indicator gauging business activity in the US manufacturing sector. The indicator is obtained from a survey of manufacturing supply executives based on information they have collected within their respective organizations. Survey responses reflect the change, if any, in the current month compared to the previous month. A reading above 50 indicates that the manufacturing economy is generally expanding, a bullish sign for the US Dollar (USD). A reading below 50 signals that factory activity is generally declining, which is seen as bearish for USD.