
Australian Dollar remains weaker following GDP, China Services PMI data
- The Australian Dollar remains weaker following the mixed economic data on Wednesday.
- Australia’s Gross Domestic Product grew by 0.2% QoQ in Q2, an improvement from the previous quarter’s growth of 0.1%.
- The US ISM Manufacturing PMI inched up to 47.2 in August from 46.8 in July.
The Australian Dollar (AUD) pares daily losses against the US Dollar (USD) following the release of the key economic data on Wednesday. Australia’s Gross Domestic Product (GDP) posted a 0.2% reading QoQ for the second quarter, up from the previous quarter’s 0.1% but falling short of the expected 0.3% readings. Additionally, China’s Services Purchasing Managers’ Index (PMI) fell from 52.1 in July to 51.6 in August, which is notable considering the close trade relationship between China and Australia.
The upbeat Australian August Purchasing Managers Index (PMI) might have provided some support to the Australian Dollar (AUD) and limited the downside of the AUD/USD pair. Traders are now focusing on the upcoming speech by Reserve Bank of Australia (RBA) Governor Michele Bullock on Thursday, to gather more insights into the central bank’s hawkish stance on monetary policy.
The US Dollar receives support as traders evaluate the economic and monetary outlook. The ISM Manufacturing PMI indicated that factory activity contracted for the fifth consecutive month, with the pace of decline slightly exceeding expectations. This renewed concerns about the impact of elevated interest rates on the health of the US economy.
Traders now await more economic data due this week, including the ISM Services PMI and Nonfarm Payrolls (NFP) to shed light on the potential size of an expected rate cut by the Fed this month.
Daily Digest Market Movers: Australian Dollar extends losses after key economic data
- The Judo Bank Composite PMI climbed to 51.7 in August, up from 51.4 in July, signaling the fastest expansion in three months. This growth was primarily fueled by a rise in services activity, with the Services PMI reaching 52.5 in August, up from 52.2 in July, marking the seventh consecutive month of growth in the services sector.
- The US ISM Manufacturing PMI inched up to 47.2 in August from 46.8 in July, falling short of market expectations of 47.5. This marks the 21st contraction in US factory activity over the past 22 months.
- Australia’s Building Permits surged by 10.4% month-over-month in July, sharply rebounding from a 6.5% decline in June, marking the strongest growth since May 2023. On an annual basis, the growth rate reached 14.3%, a significant recovery from the previous 3.7% decline.
- China’s Caixin Manufacturing PMI rose to 50.4 in August, up from 49.8 in July, which is particularly noteworthy given China’s close trade relationship with Australia.
- The US Bureau of Economic Analysis reported on Friday that the headline Personal Consumption Expenditures (PCE) Price Index increased by 2.5% year-over-year in July, matching the previous reading of 2.5% but falling short of the estimated 2.6%. Meanwhile, the core PCE, which excludes volatile food and energy prices, rose by 2.6% year-over-year in July, consistent with the prior figure of 2.6% but slightly below the consensus forecast of 2.7%.
- The US Gross Domestic Product (GDP) grew at an annualized rate of 3.0% in the second quarter, exceeding both the expected and previous growth rate of 2.8%. Additionally, Initial Jobless Claims showed that the number of people filing for unemployment benefits fell to 231,000 for the week ending August 23, down from the previous 233,000 and slightly below the expected 232,000.
- Australia’s Private Capital Expenditure unexpectedly declined by 2.2% in the second quarter, reversing from an upwardly revised 1.9% expansion in the previous period and falling short of market expectations for a 1.0% increase. This marks the first contraction in new capital expenditure since the third quarter of 2023.
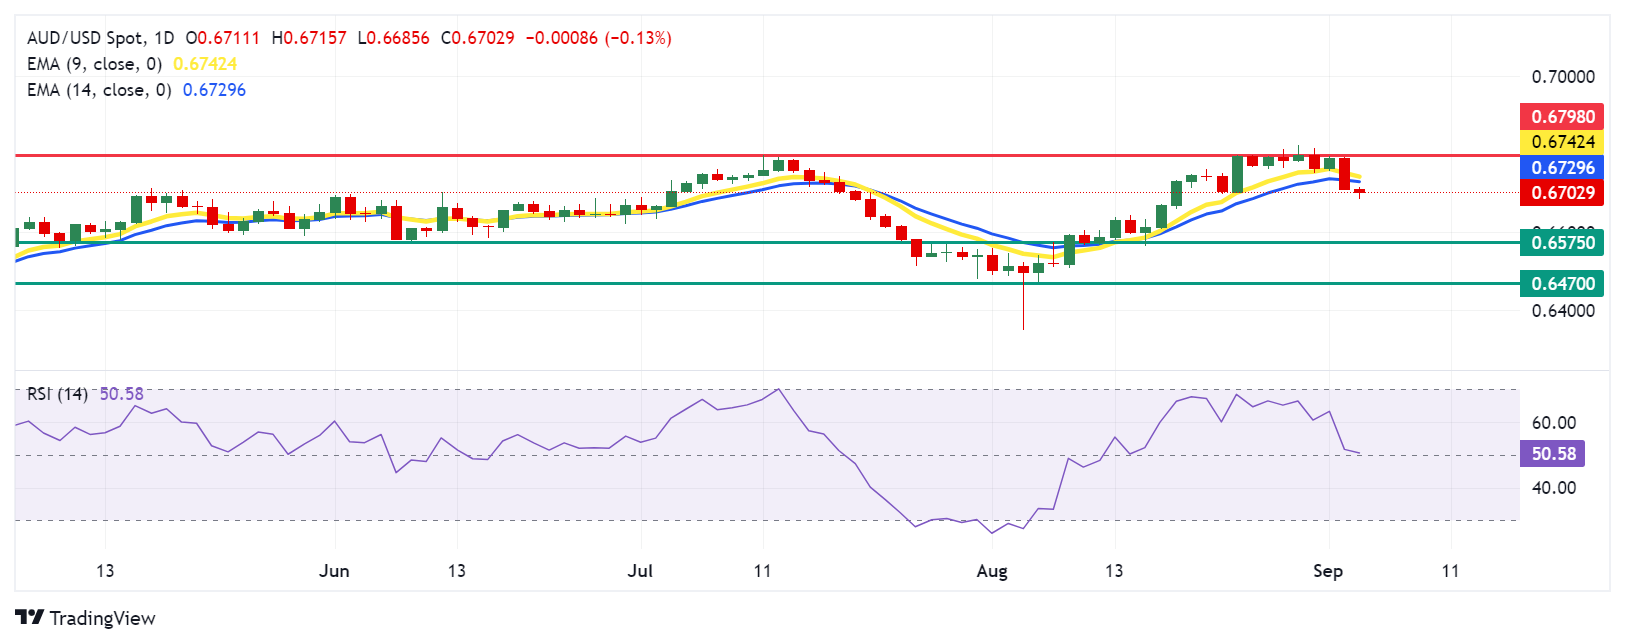
Technical Analysis: Australian Dollar falls to near 0.6700
The Australian Dollar trades around 0.6700 on Wednesday. Analyzing the daily chart, the AUD/USD pair has breached below the nine-day Exponential Moving Average (EMA), suggesting a short-term bearish trend. Additionally, the 14-day Relative Strength Index (RSI) has also moved below the 50 level, confirming the bearish bias.
On the downside, the AUD/USD pair may navigate the region around the throwback level at 0.6575, with further decline possibly targeting the lower support at 0.6470.
In terms of resistance, the AUD/USD pair may test immediate support around the 14-day EMA at 0.6729, followed by the nine-day EMA at 0.6742. A break above these EMAs could support the pair in testing the seven-month high of 0.6798.
AUD/USD: Daily Chart
Australian Dollar PRICE Today
The table below shows the percentage change of Australian Dollar (AUD) against listed major currencies today. Australian Dollar was the weakest against the Swiss Franc.
| USD | EUR | GBP | JPY | CAD | AUD | NZD | CHF | |
|---|---|---|---|---|---|---|---|---|
| USD | -0.09% | 0.03% | -0.03% | -0.10% | 0.14% | 0.10% | -0.15% | |
| EUR | 0.09% | 0.13% | 0.06% | 0.00% | 0.24% | 0.22% | -0.08% | |
| GBP | -0.03% | -0.13% | -0.06% | -0.13% | 0.11% | 0.11% | -0.22% | |
| JPY | 0.03% | -0.06% | 0.06% | -0.08% | 0.16% | 0.13% | -0.15% | |
| CAD | 0.10% | -0.00% | 0.13% | 0.08% | 0.23% | 0.23% | -0.09% | |
| AUD | -0.14% | -0.24% | -0.11% | -0.16% | -0.23% | -0.02% | -0.30% | |
| NZD | -0.10% | -0.22% | -0.11% | -0.13% | -0.23% | 0.02% | -0.30% | |
| CHF | 0.15% | 0.08% | 0.22% | 0.15% | 0.09% | 0.30% | 0.30% |
The heat map shows percentage changes of major currencies against each other. The base currency is picked from the left column, while the quote currency is picked from the top row. For example, if you pick the Australian Dollar from the left column and move along the horizontal line to the US Dollar, the percentage change displayed in the box will represent AUD (base)/USD (quote).
Economic Indicator
Gross Domestic Product (QoQ)
The Gross Domestic Product (GDP), released by the Australian Bureau of Statistics on a quarterly basis, is a measure of the total value of all goods and services produced in Australia during a given period. The GDP is considered as the main measure of Australian economic activity. The QoQ reading compares economic activity in the reference quarter to the previous quarter. Generally, a rise in this indicator is bullish for the Australian Dollar (AUD), while a low reading is seen as bearish.