Elliott Wave suggests double correction in META to provide buying opportunity [Video]

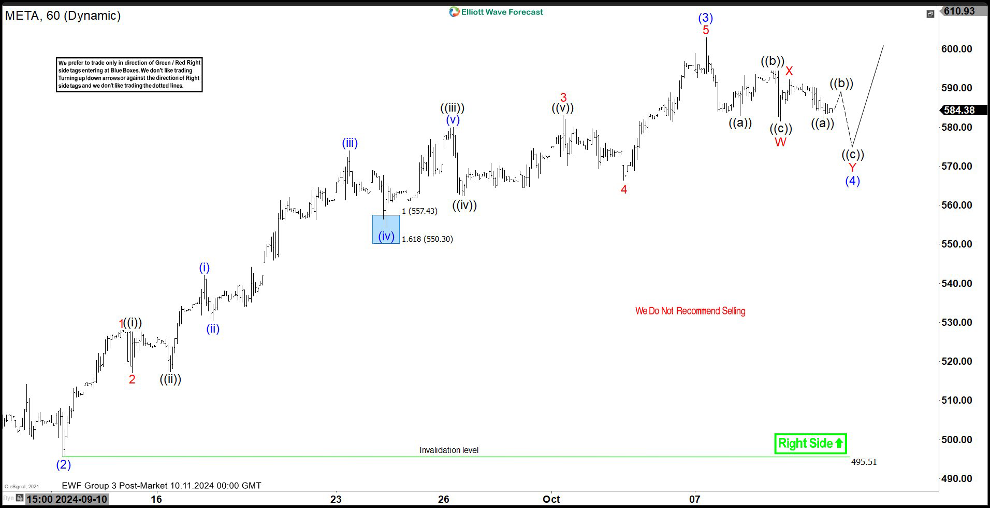
Short term Elliott Wave View in META suggests that rally from 7.25.2024 low is in progress as an impulsive structure. Up from 7.25.2024 low, wave (1) ended at 544.23. Wave (2) pullback ended at 495.51 as the 1 hour chart below shows. Up from there, the stock extended higher in wave ((3)) as an impulse. Wave 1 of (3) ended at 527.94 and pullback in wave 2 of (3) ended at 517.11. Stock extends higher again in wave 3 of (3) towards 583.04 and wave 4 of ((3)) ended at 566.4. Final leg wave 5 ended at 602.95 which completed wave (3).
Wave (4) pullback is currently in progress as a double three Elliott Wave structure. Down from wave 93), wave W ended at 581.61 and rally in wave X ended at 592.18. Expect Wave Y to extend lower towards 100% – 161.8% Fibonacci extension of wave W. This area comes at 557.7 – 579.8 where wave Y of (4) should end. From this area, the stock should resume higher again or at least rally in 3 waves. Near term, as far as pivot at 495.51 low stays intact, expect pullback to find support in 3, 7, or 11 swing for further upside.
