
Gold price climbs to all-time high on US election woes
- Gold surges to $2,691, boosted by uncertainty surrounding US elections, despite robust Retail Sales and job data.
- US 10-year Treasury yield rebounds to 4.096%, capping Gold’s advance as the US Dollar Index reaches a two-month high.
- Traders trim bets on a Fed rate cut, with odds for a November 25 bps reduction dropping to 88.2%.
Gold price hit a record high during the North American session on Thursday, yet it failed to hit $2,700 amid uncertainty around US elections. Data-wise, the US economy remains resilient following Retail Sales and jobs data, though it didn’t weigh on the precious metal. At the time of writing, the XAU/USD trades at $2,691, up by over 0.66%.
The US Department of Commerce revealed that Retail Sales rose slightly above estimates. At the same time, the US Labor Department revealed data on fewer Initial Jobless Claims, which weighed on Bullion prices.
After the data, the US 10-year Treasury yield rebounded off its lows, rising eight basis points to 4.096%. The Gold price dipped to $2,672 but has recovered some ground, shrugging off broad US Dollar strength.
The US Dollar Index (DXY), which tracks the Greenback’s currency against a basket of six peers, rose over 0.26% to 103.79, a nearly two-month peak.
Following the data, the Atlanta Fed GDP Now estimates the US Gross Domestic Product (GDP) to grow 3.4% from 3.2% on October 9.
Given the backdrop, traders trimmed their bets on the Federal Reserve’s (Fed) easing in the final two Fed meetings of the year. For the upcoming November meeting, the odds for a 25 bps rate cut decreased from 94% to 88.2%; while the chances of the Fed standing pat are at 11.8%.
“On top of the concerns in the Middle East, you are also nearing the US election, which is looking like a very closely contested election. And that generates a whole host of uncertainty, and Gold often is the place to go in times of uncertainty,” said Niteh Shah, a strategist at WisdomTree.
Daily digest market movers: Gold price climbs as investors eye key US data
- US Retail Sales for September rose by 0.4% (MoM), exceeding estimates of 0.3% and higher than August’s 0.1% increase.
- Initial Jobless Claims for the week ending October 12 came in at 241K, below estimates and down from last week’s 258K.
- US Industrial Production contracted by -0.3% MoM in September, reversing from 0.3% growth, impacted by external factors.
- Data from the Chicago Board of Trade, based on the December fed funds rate futures contract, indicates that investors estimate 48 basis points of Fed easing by the end of the year.
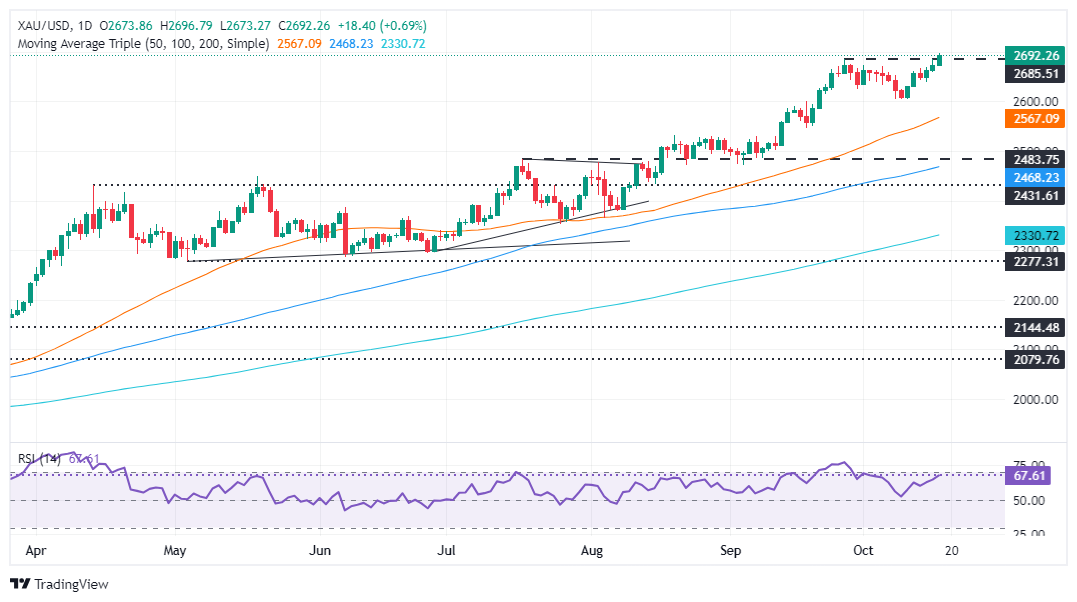
XAU/USD technical outlook: Gold price surges above $2,690, eyes on $2,700
Gold’s upward bias is intact. Bulls could push the XAU/USD spot price toward the psychological $2,700 figure in the short term as the Relative Strength Index (RSI) suggests buyers are gathering steam.
Gold’s first resistance is the YTD high at $2,696. Once cleared, a move to $2,700 is on the cards, followed by $2,750 and $2,800.
Conversely, if XAU/USD falls below the October 4 high at $2,670, a retracement toward $2,650 is on the cards. On further weakness, the next support would be $2,600, followed by the 50-day Simple Moving Average (SMA) at $2,561.
Economic Indicator
Retail Sales (MoM)
The Retail Sales data, released by the US Census Bureau on a monthly basis, measures the value in total receipts of retail and food stores in the United States. Monthly percent changes reflect the rate of changes in such sales. A stratified random sampling method is used to select approximately 4,800 retail and food services firms whose sales are then weighted and benchmarked to represent the complete universe of over three million retail and food services firms across the country. The data is adjusted for seasonal variations as well as holiday and trading-day differences, but not for price changes. Retail Sales data is widely followed as an indicator of consumer spending, which is a major driver of the US economy. Generally, a high reading is seen as bullish for the US Dollar (USD), while a low reading is seen as bearish.
Last release: Thu Oct 17, 2024 12:30
Frequency: Monthly
Actual: 0.4%
Consensus: 0.3%
Previous: 0.1%
Source: US Census Bureau