Visa Inc. (V) Elliott Wave technical analysis [Video]

V Elliott Wave technical analysis
Function: Trend.
Mode: Impulsive.
Structure: Motive.
Position: Wave {iv} of 5.
Direction: Upside in wave {v} in 5.
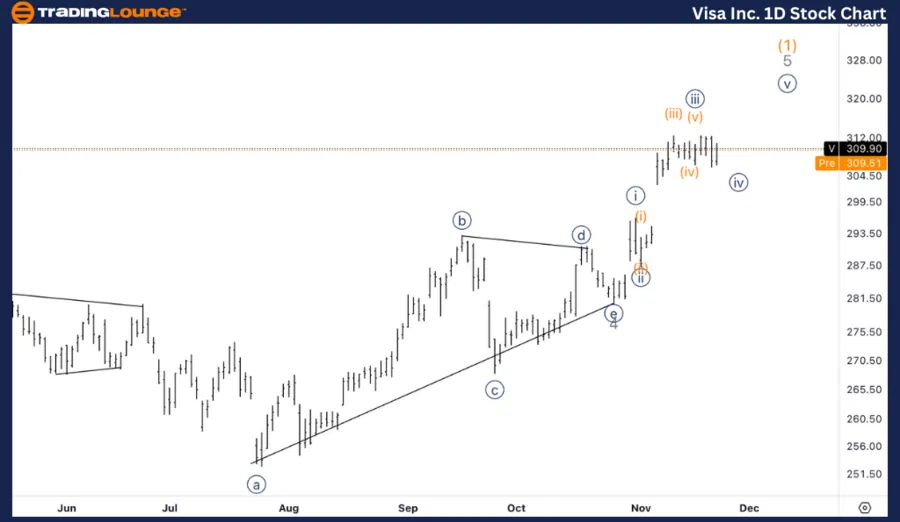
Details: Looking for consolidation in wave {iv} as we stand at the beginning of MinorGroup1 at 310$.
V Elliott Wave technical analysis – Daily chart
Visa (V) is currently in wave {iv} of 5, with the expectation of further consolidation as the price is hovering around the MinorGroup1 level at 310$. This wave is typically a corrective phase, and once complete, it should lead to an upside move in wave {v} to complete the fifth wave of the larger motive structure. The key to confirming this will be how the price reacts to the ongoing consolidation.
V Elliott Wave technical analysis
Function: Trend.
Mode: Impulsive.
Structure: Motive.
Position: Wave (a) of {iv}.
Direction: Completion in wave {iv}.
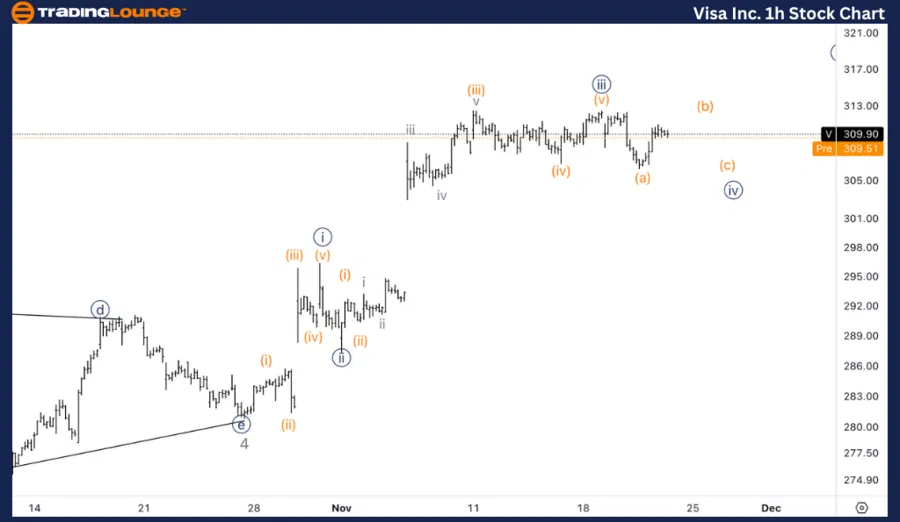
Details: Looking for a potential pullback into wave (b) to then fall back down into wave (c). There is a probability we have already completed wave {iv} as we stand in the area of the previous (iv), as well as we can identify a three wave move in what is currently labelled as (a).
V Elliott Wave technical analysis – One-hour chart
On the 1-hour chart, Visa seems to have completed wave (a) of the corrective wave {iv}. The structure shows a potential three-wave move in wave (a), suggesting that we may see a pullback in wave (b) before completing wave (c) of {iv}. There is also a possibility that wave {iv} may already be completed, as the price is currently in the area of the previous wave (iv), adding to the probability that wave {v} could start soon.
This analysis of Visa Inc., (V) focuses on both the daily and 1-hour charts, using the Elliott Wave Theory to assess current market trends and forecast future price movements.

