
US Dollar near flat after US GDP’s first reading contracts
- The US Dollar trades flat against most major currencies.
- The initial reading of the US GDP for the first quarter turns negative.
- The US Dollar Index is capped below the 100.00 round level ahead of key US data.
The US Dollar Index (DXY), which tracks the performance of the US Dollar (USD) against six major currencies, trades flat at 99.30 at the time of writing on Wednesday. The Greenback is not really going anywhere as investors stay on the sidelines against key data releases during the American session. United States (US) President Donald Trump signed an executive order to ease the tariff impact on car parts and, during a rally in Detroit, lashed out at Federal Reserve Chairman Jerome Powell again, proclaiming Trump knows more about interest rates than Powell does.
On the economic calendar front, a general rehearsal will take place this Wednesday ahead of the Nonfarm Payrolls release on Friday. The US Gross Domestic Product (GDP) preliminary reading for Q1 will already be a vital element to assess the first impact, if any, of the administration’s tariff policy. And that reading was a very bearish print, with GDP falling into contraction by -0.3%, missing the positive 0.4% expected.
Daily digest market movers: Recession fears to emerge
- The preliminary reading of the first quarter for US Gross Domestic Product saw the annualized rate fall into contraction by 0.3%, missing the growth forecast of 0.4% and much slower than the 2.4% expansion seen in 2024’s fourth quarter. The Personal Consumption Expenditures (PCE) component under the quarterly reading revealed upside pressure in price with the headline PCE reading coming in at 3.6%, from 2.4% in the last quarter of 2024. Core PCE came in red hot at 3.5%, from 2.6% in the previous quarter. This could even be perceived as stagflation.
- Around 13:35 GMT, the Chicago Purchasing Manager’s Index for April is due. Expectations are for a further contraction to 45.5 from 47.6.
- At 14:00 GMT, the monthly PCE data for March will also be released. The Monthly Core PCE is expected to come in at 0.1%, down from 0.4%. The monthly headline number is expected to fall to 0%, from 0.3% previously.
- Equities dive lower with the Nasdaq futures down 1.6% ahead of the US opening bell. European equities are unphased and trade flat.
- The CME FedWatch tool shows the chance of an interest rate cut by the Federal Reserve in the May’s meeting stands at 7.6% against a 92.4% probability of no change. The June meeting sees a 65.1% chance of a rate cut.
- The US 10-year yields trade around 4.20%, erasing earlier dips in yields and paring back on rate cut bets.
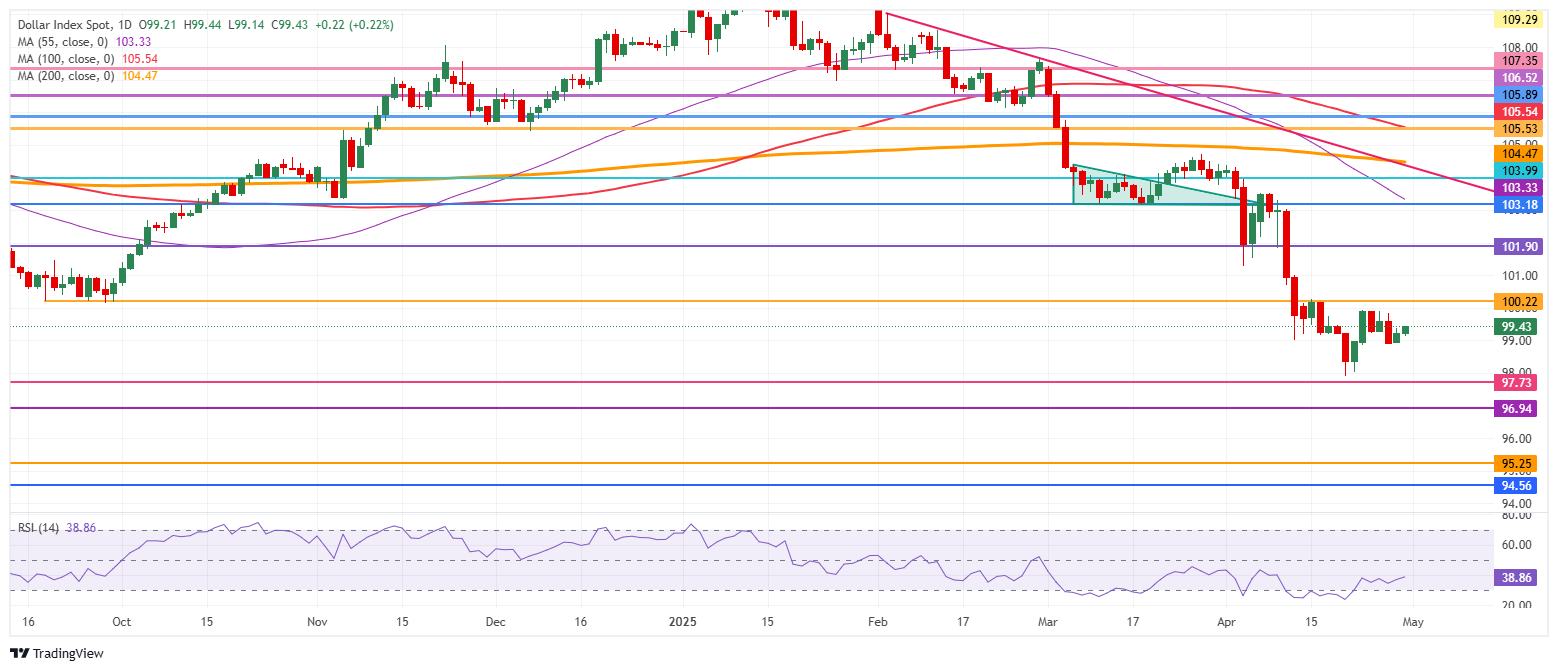
US Dollar Index Technical Analysis: Watch out for the lag effect
The US Dollar Index (DXY) is starting to pick up from its low levels of 2025. Bulls are slowly starting to take back control of the chart. However, risk elements persist with the uncertainty and possible further deterioration of US data likely to cause the DXY to edge substantially lower.
On the upside, the DXY’s first resistance comes in at 100.22, which supported the DXY back in September 2024, with a break back above the 100.00 round level as a bullish signal. A firm recovery would be a return to 101.90, which acted as a pivotal level throughout December 2023 and again as a base for the inverted head-and-shoulders (H&S) formation during the summer of 2024.
On the other hand, the 97.73 support could quickly be tested on any substantial bearish headline. Further below, a relatively thin technical support comes in at 96.94 before looking at the lower levels of this new price range. These would be at 95.25 and 94.56, meaning fresh lows not seen since 2022.
US Dollar Index: Daily Chart
GDP FAQs
A country’s Gross Domestic Product (GDP) measures the rate of growth of its economy over a given period of time, usually a quarter. The most reliable figures are those that compare GDP to the previous quarter e.g Q2 of 2023 vs Q1 of 2023, or to the same period in the previous year, e.g Q2 of 2023 vs Q2 of 2022.
Annualized quarterly GDP figures extrapolate the growth rate of the quarter as if it were constant for the rest of the year. These can be misleading, however, if temporary shocks impact growth in one quarter but are unlikely to last all year – such as happened in the first quarter of 2020 at the outbreak of the covid pandemic, when growth plummeted.
A higher GDP result is generally positive for a nation’s currency as it reflects a growing economy, which is more likely to produce goods and services that can be exported, as well as attracting higher foreign investment. By the same token, when GDP falls it is usually negative for the currency.
When an economy grows people tend to spend more, which leads to inflation. The country’s central bank then has to put up interest rates to combat the inflation with the side effect of attracting more capital inflows from global investors, thus helping the local currency appreciate.
When an economy grows and GDP is rising, people tend to spend more which leads to inflation. The country’s central bank then has to put up interest rates to combat the inflation. Higher interest rates are negative for Gold because they increase the opportunity-cost of holding Gold versus placing the money in a cash deposit account. Therefore, a higher GDP growth rate is usually a bearish factor for Gold price.