
EUR/CAD Price Analysis: Euro steadies near 1.5600 as bullish signals hold firm
- EUR/CAD trades around the 1.5600 zone after solid gains in Tuesday’s session.
- Mixed momentum signals, with broader trend support from longer-term averages.
- Key support levels hold below, while resistance clusters just above current levels.
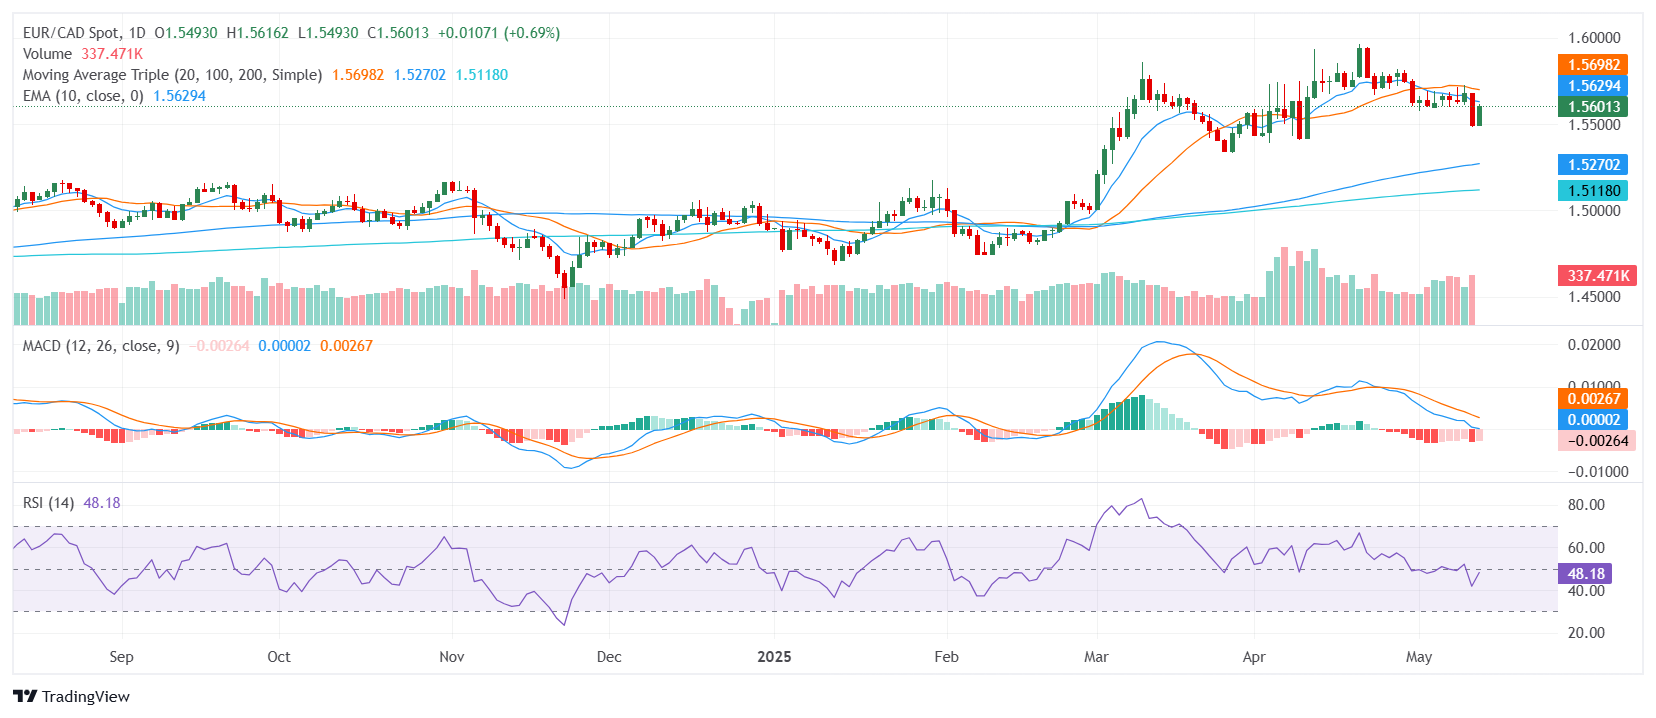
The EUR/CAD pair advanced on Tuesday, trading near the 1.5600 zone after the European session, reflecting a strong bullish tone as the market heads into the Asian session. The pair remains positioned within the middle of its recent range, suggesting that buyers maintain control despite mixed short-term signals. The broader technical structure remains supportive, underpinned by a cluster of rising moving averages that continue to reinforce the overall uptrend.
From a technical perspective, the pair presents a mixed but generally positive outlook. The Relative Strength Index sits in the 40s, reflecting balanced momentum without immediate overbought pressure. The Moving Average Convergence Divergence, however, continues to flash a sell signal, highlighting the potential for short-term pullbacks. Meanwhile, the Average Directional Index remains in the 20s, reflecting a relatively weak trend strength, while the Williams Percent Range and Ultimate Oscillator also sit in neutral territory, suggesting the current momentum may lack conviction.
The broader trend structure is more supportive. The 100-day and 200-day Simple Moving Averages remain well below current levels and continue to slope upward, providing strong underlying support. Additionally, the 50-day Exponential Moving Average and 9-day Hull Moving Average also reinforce the bullish outlook, further supporting the broader uptrend despite the mixed short-term signals from momentum indicators.
Support levels are located at 1.5580, 1.5548, and 1.5372. Resistance is found at 1.5621, 1.5623, and 1.5627. A sustained move above the immediate resistance zone could confirm a broader breakout, while a drop below support might trigger a short-term correction, potentially testing the lower end of the recent range.