
Gold struggles to capitalize on intraday bounce from one-week low; US-China trade talks awaited
- Gold price reverses an intraday slide to sub-$3,300 levels amid a weaker USD.
- Rising geopolitical risks lend additional support to the safe-haven precious metal.
- Friday’s US NFP report tempered Fed rate cut bets and caps the XAU/USD pair.
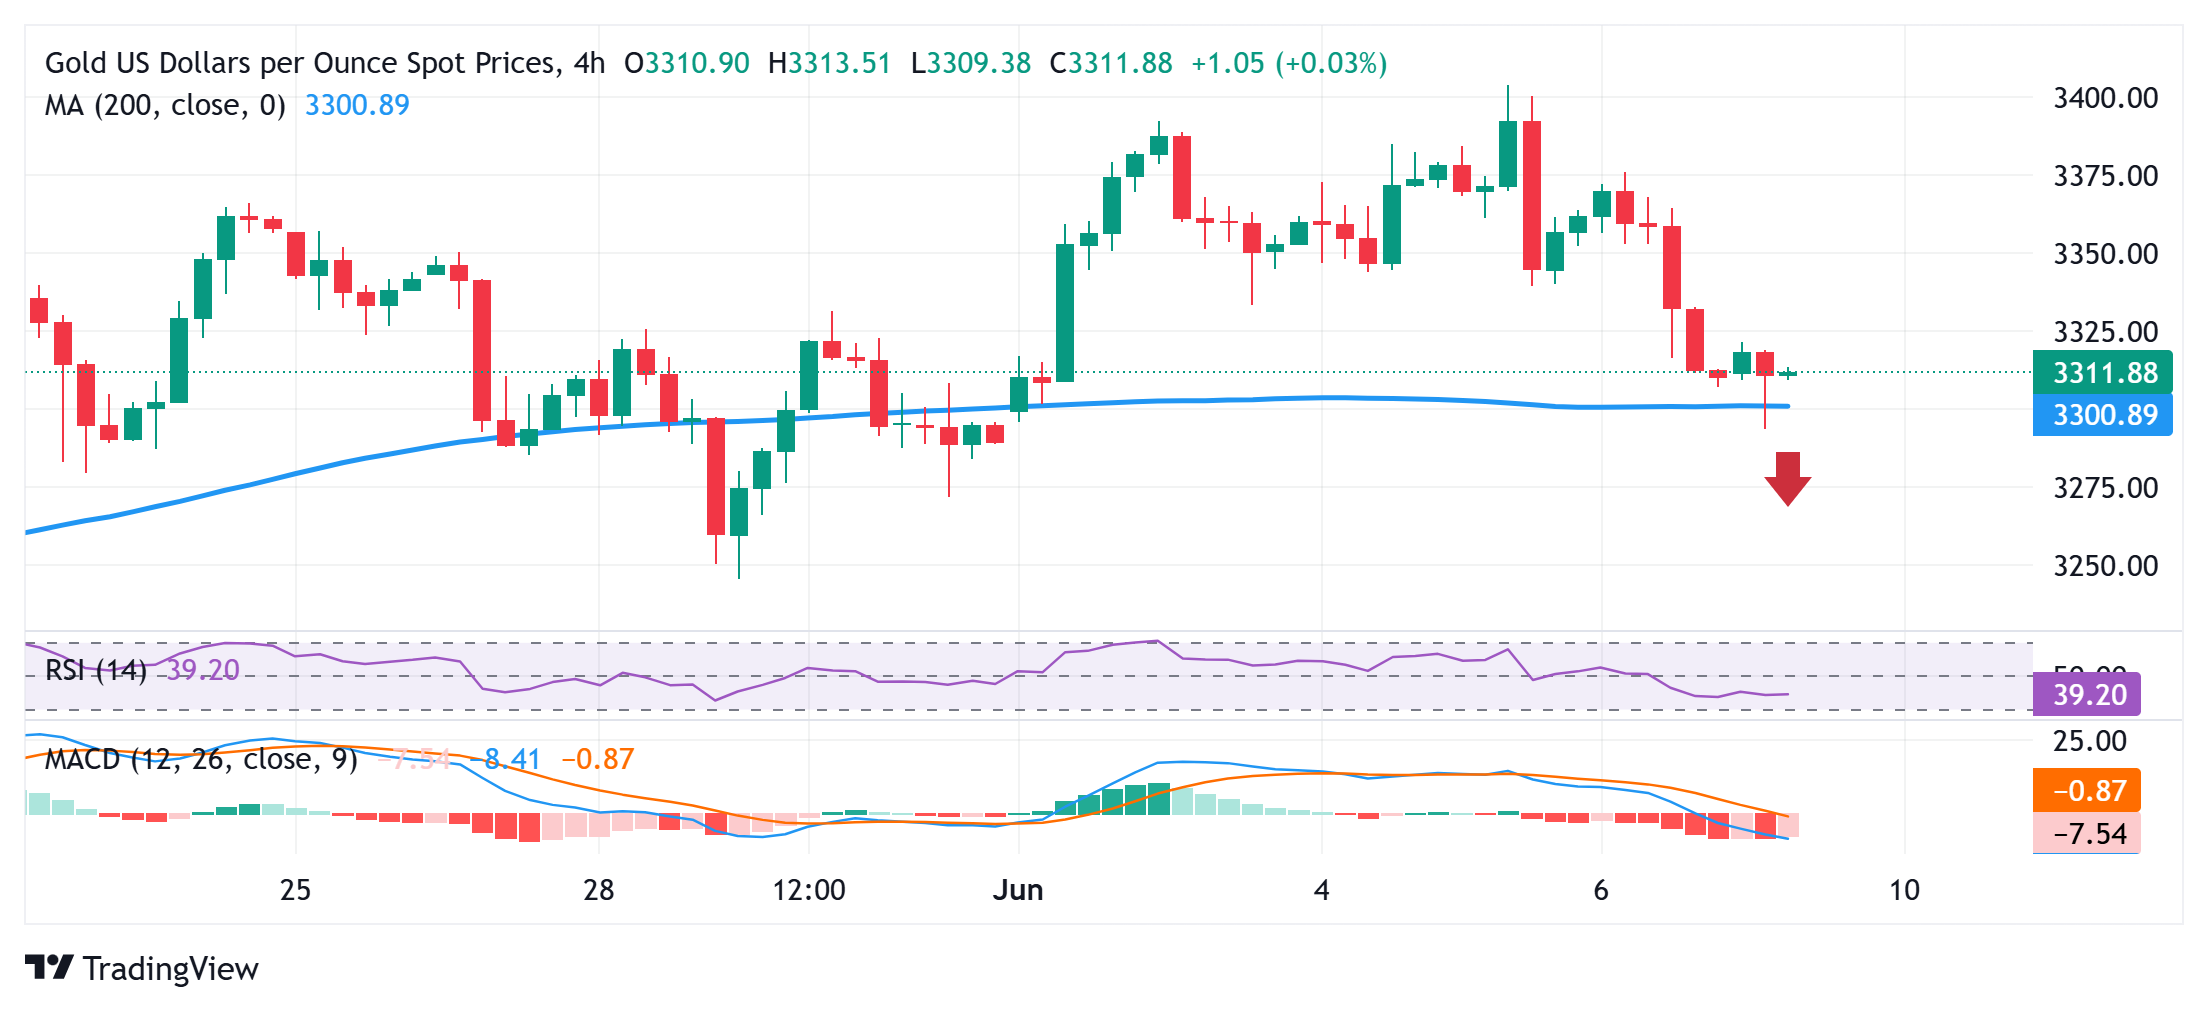
Gold price (XAU/USD) sticks to modest intraday recovery gains through the first half of the European session and for now, seems to have snapped a two-day losing streak. The US Dollar (USD) struggles to capitalize on Friday’s gains, amid US fiscal concerns, and turns out to be a key factor that assists the bullion to reverse an intraday dip to sub–$3,300 levels, or a one-week low.
Apart from this, rising geopolitical tensions and persistent trade-related uncertainties act as a tailwind for the safe-haven Gold price. However, Friday’s stronger US jobs data dampened hopes for imminent interest rate cuts by the pair might then accelerate the slide below the $3,283-3,282 region, towards the $3,246-3,245 area (May 29 swing low) en route to the $3,200 neighborhood.
On the flip side, any meaningful move higher is likely to confront a stiff barrier and attract fresh sellers near the $3.352-3,353 horizontal zone. This, in turn, should cap the Gold price near the $3,377-3,378 resistance. A sustained strength beyond the latter, however, could trigger a short-covering rally and allow the XAU/USD bulls to make a fresh attempt to conquer the $3,400 round figure. The momentum could extend further towards the $3,425-3,430 region en route to the all-time top, around the $3,500 psychological mark touched in April.
US Dollar PRICE Today
The table below shows the percentage change of US Dollar (USD) against listed major currencies today. US Dollar was the strongest against the Canadian Dollar.
| USD | EUR | GBP | JPY | CAD | AUD | NZD | CHF | |
|---|---|---|---|---|---|---|---|---|
| USD | -0.27% | -0.31% | -0.52% | -0.13% | -0.46% | -0.66% | -0.18% | |
| EUR | 0.27% | -0.05% | -0.26% | 0.13% | -0.18% | -0.40% | 0.08% | |
| GBP | 0.31% | 0.05% | -0.12% | 0.19% | -0.12% | -0.35% | 0.14% | |
| JPY | 0.52% | 0.26% | 0.12% | 0.40% | 0.00% | -0.21% | 0.22% | |
| CAD | 0.13% | -0.13% | -0.19% | -0.40% | -0.36% | -0.54% | -0.06% | |
| AUD | 0.46% | 0.18% | 0.12% | -0.00% | 0.36% | -0.23% | 0.26% | |
| NZD | 0.66% | 0.40% | 0.35% | 0.21% | 0.54% | 0.23% | 0.49% | |
| CHF | 0.18% | -0.08% | -0.14% | -0.22% | 0.06% | -0.26% | -0.49% |
The heat map shows percentage changes of major currencies against each other. The base currency is picked from the left column, while the quote currency is picked from the top row. For example, if you pick the US Dollar from the left column and move along the horizontal line to the Japanese Yen, the percentage change displayed in the box will represent USD (base)/JPY (quote).