Dollar Index Hits Multi-Year Low and Broke Long Term Fibonacci Level – Action Forex
Dollar ended last week as the weakest major currency, with Dollar Index breaking to a fresh three-year low. Risk-on sentiment was a key driver: US equities surged following the Israel-Iran ceasefire, and S&P 500 and NASDAQ both posted record closes on Friday. Rising expectations of rate cuts from Fed later this year also contributed to Dollar’s selloff, as markets added bets on a September move.
More structurally, sentiment toward Dollar continued to souring as investors reassess its role as a global anchor of stability. Stagflation fears, concerns over fiscal sustainability, and volatility in US trade and policy have all raised red flags. This repositioning away from the dollar is not merely technical—it reflects a deeper shift in global reserve management and private capital flows.
After years of heavy USD allocation, investors are actively diversifying, with Euro-denominated and Swiss Franc assets among the key beneficiaries. If the tariff truce ends without compromise in early July, it could further accelerate this reallocation.
Dollar Index Breaks Long-Term Fibonacci Support
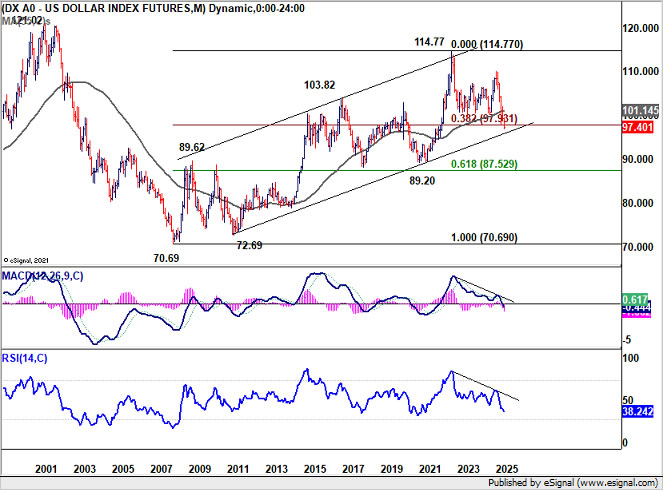
Technically, for the near term, further decline is expected in Dollar Index as long as 99.42 resistance holds. Next target is 61.8% projection of 110.17 to 97.92 from 101.97 at 94.40.
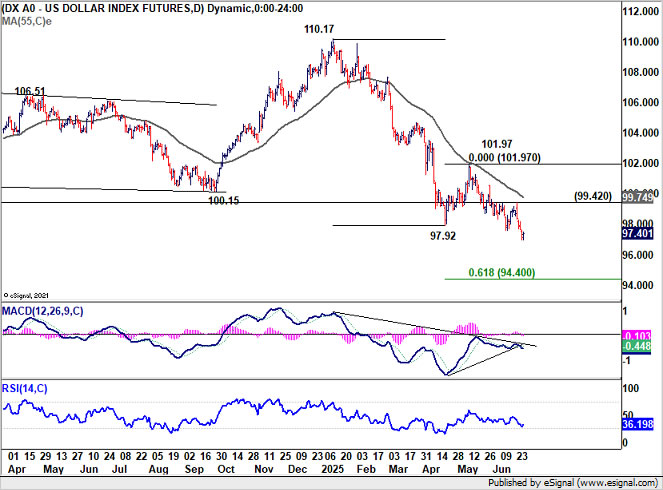
More importantly, as seen in the monthly chart, the close below 38.2% retracement of 70.69 (2008 low) to 114.77 (2022 high) at 97.93 is a bearish sign. Decisive break of long term channel support (now at 95.80) will suggest that whole up trend from 70.69 has already completed. Deeper medium term fall would be seen to 61.8% retracement at 87.52, even still as a corrective move.
Fed Pushback Delays July Cut, but Markets Bank on September
With the Israel-Iran conflict de-escalated, markets refocused on the Fed. Despite warnings from multiple Fed speakers that July is too soon to cut, there is widespread acknowledgment that the easing cycle will resume later in the year—likely in September.
Fed Governor Michelle Bowman added her voice in favor of an earlier move, echoing fellow Governor Christopher Waller’s recent comments. Notably, both officials are rumored candidates for the next Fed Chair, lending political weight to their dovish stance.
Still, Chair Jerome Powell struck a more careful tone in his Congressional testimony, warning that there’s no modern precedent for the scale of Trump’s proposed tariffs. While a one-time price jump is possible, the risk of more persistent inflation cannot be dismissed. Most Fed officials, including Williams, Bostic, and Collins, stressed patience too.
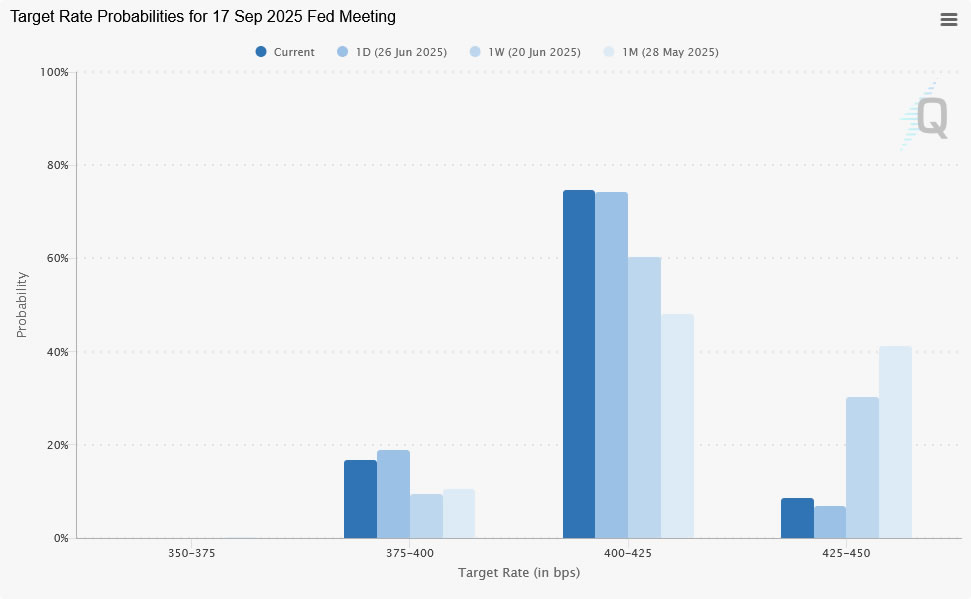
Markets, however, was more focused on softening data. Personal consumption unexpectedly contracted in May, while core PCE inflation edged up just slightly to 2.7%—a result that added to growing confidence that Fed act again soon. As a result, odds of a September rate cut now exceed 90%, up from around 70% last week.
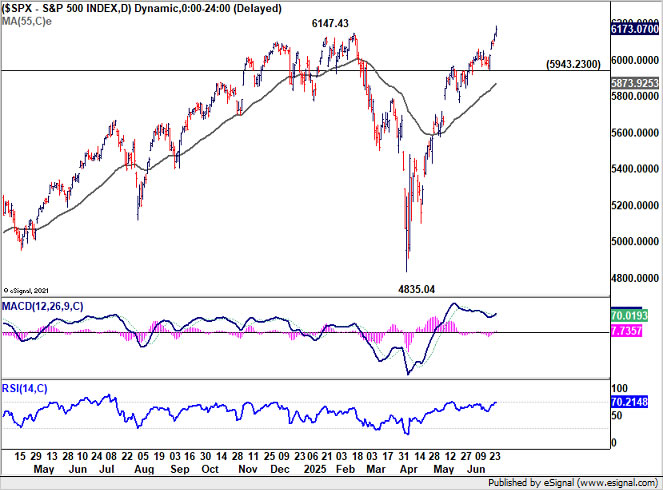
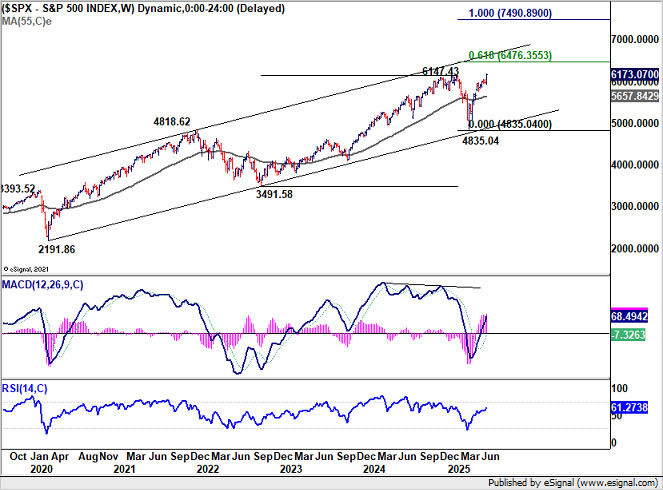
S&P 500 and NASDAQ rallied strongly to record levels, fueled by both easing bets and fading geopolitical risks. Technically, S&P 500’s break of 6147.43 high with such ease is a surprise to us. Anyway, near term outlook will now stay bullish as long as 5943.23 support holds. Current up trend would target 61.8% projection of 3491.58 to 6147.43 from 4835.04 next.
Trade Tensions Resurface as Canada Hit Again by Tariff Threats
Attention is also shifting back to trade risks as the 90-day US tariff truce with major partners approaches its July 9 expiration. On Friday, President Trump abruptly announced the termination of all trade discussions with Canada in response to Ottawa’s digital services tax on US tech giants. Trump also pledged that a new tariff package targeting Canadian exports would be revealed within a week.
At the same time, Canada has insisted it will proceed with the tax despite furious response from the US. Finance Minister Champagne stressed that Parliament has passed the law and it will be enforced starting this Monday, applying retroactively to 2022.
For Canadian Dollar, the double blow of trade tensions and weak domestic data — with GDP contracting in both April and May — adds downside pressure. Loonie was the second-worst performer last week.
Technically, EUR/CAD’s long term up trend resumed last week by breaking through 1.5959 resistance. Immediate focus is now on 1.6151 long term resistance (2018 higher). Decisive break there will pave the way to 61.8% projection of 1.4483 to 1.5959 from 1.5598 at 1.6510 next.
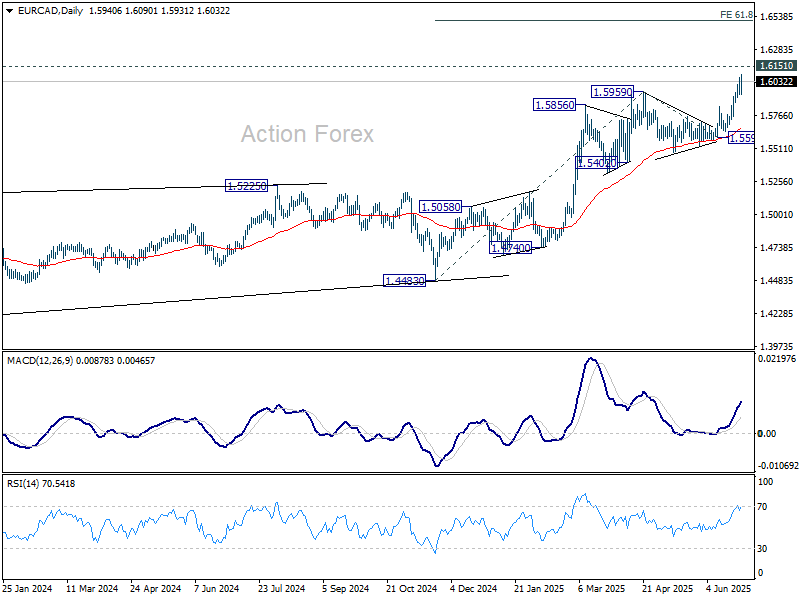
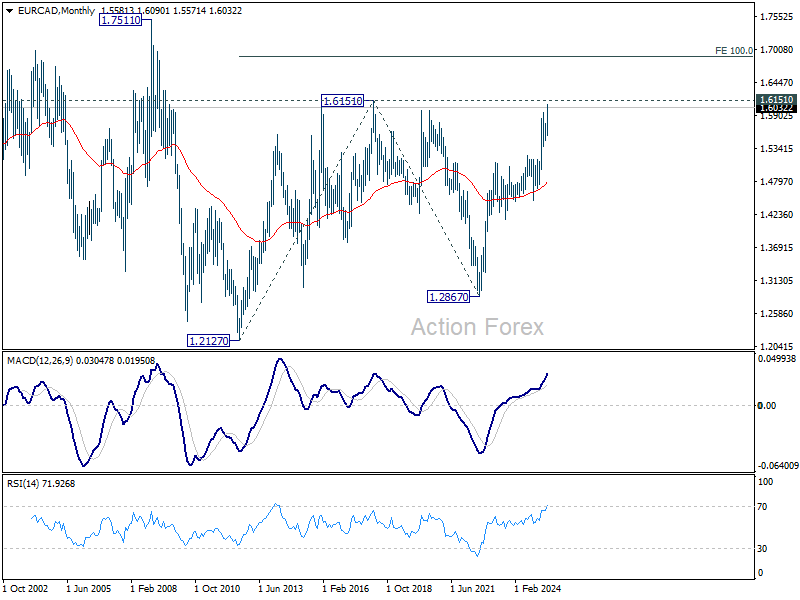
More importantly, that would also confirm resumption of whole up trend rise from 1.2127 (2021 low). Next medium term target would then be 100% projection of 1.2127 to 1.6151 from 1.2867 at 1.6891.
Euro Rally Broadens, but EUR/CHF Still Needs Breakout for Confirmation
Euro’s strength has broadened recently, driven by both narrowing policy differentials with the US and the continent’s historic fiscal pivot. Germany’s EUR 500B infrastructure fund, paired with broader NATO defense pledges, represent a structural shift. Besides, European NATO members committed last week to boosting defense spending to 5% of GDP by 2035, marking a generational investment wave.
And after all, it should be emphasized that Euro is probably the only viable liquidity alternative as investors “normalize” from their Dollar over-exposure accumulated in the past few years.
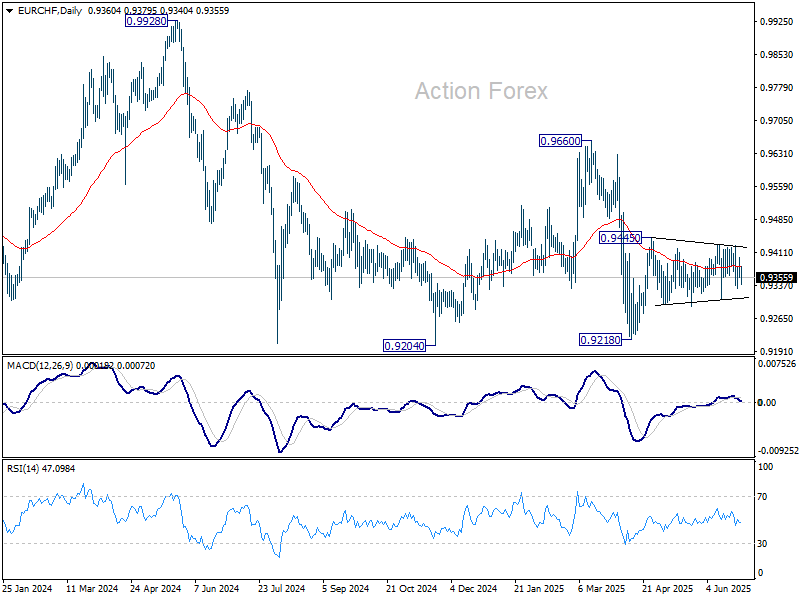
However, one pair that hasn’t confirmed Euro’s strength yet is EUR/CHF. The Franc remains resilient, despite Switzerland slipping into deflation and the SNB cutting rates to zero.
For Euro, EUR/CHF has to break through 0.9445 to resume the rise from 0.9218 to confirm that it’s underlying buying is solid. Ideally, EUR/CHF should then break through 0.9660 key resistance to signal that a medium term up trend is underway.
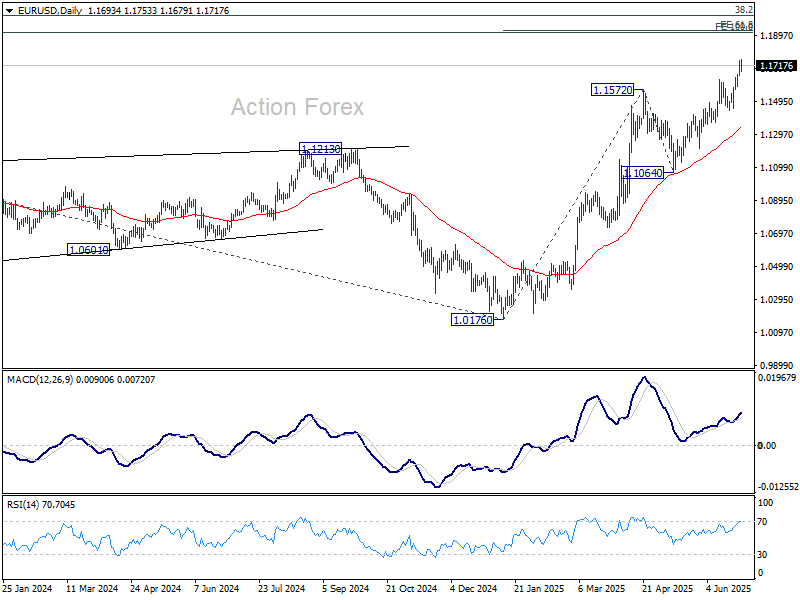
EUR/USD Weekly Outlook
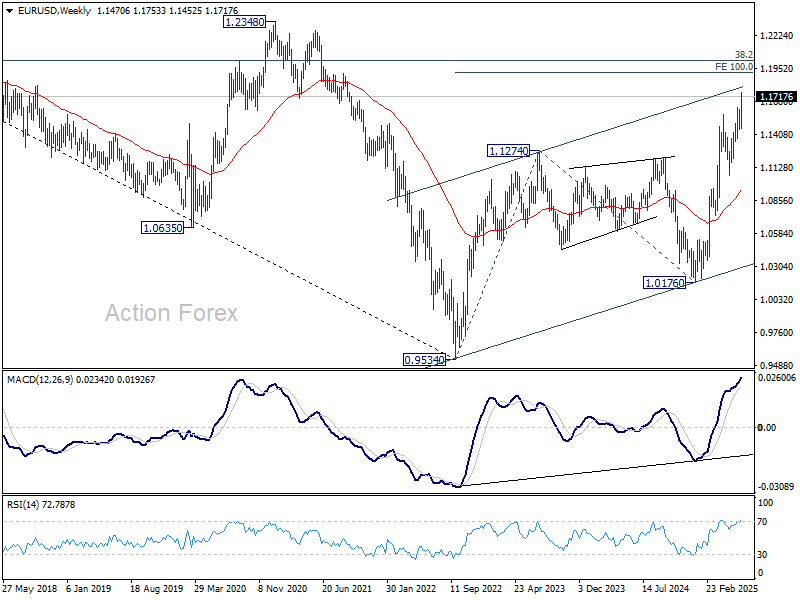
EUR/USD’s up trend resumed last week and there is no clear sign of topping yet. Initial bias stays on the upside for 61.8% projection of 1.0176 to 1.1572 from 1.1064 at 1.1927. On the downside, below 1.1679 minor support will turn intraday bias neutral and bring consolidations. But downside should be contained above 1.1452 support to bring another rally.
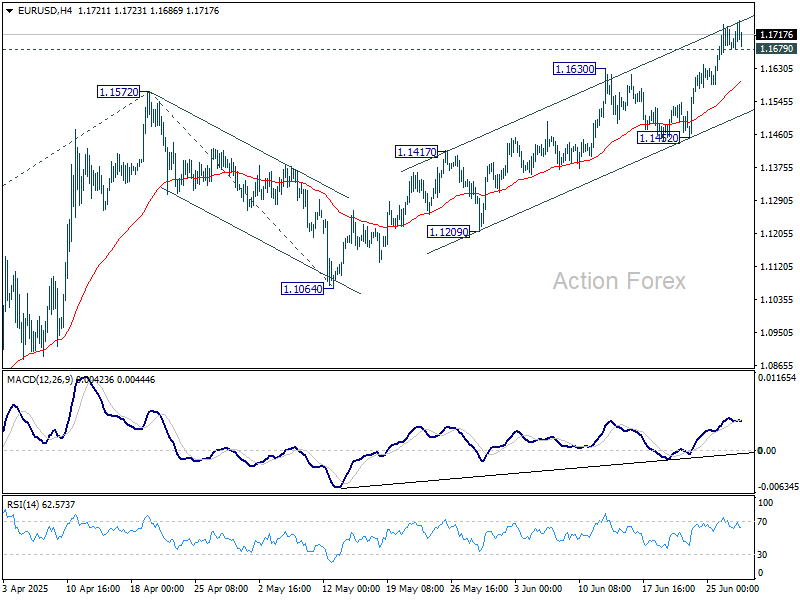
In the bigger picture, rise from 0.9534 long term bottom could be correcting the multi-decade downtrend or the start of a long term up trend. In either case, further rise should be seen to 100% projection of 0.9534 to 1.1274 from 1.0176 at 1.1916. This will now remain the favored case as long as 1.1604 support holds.
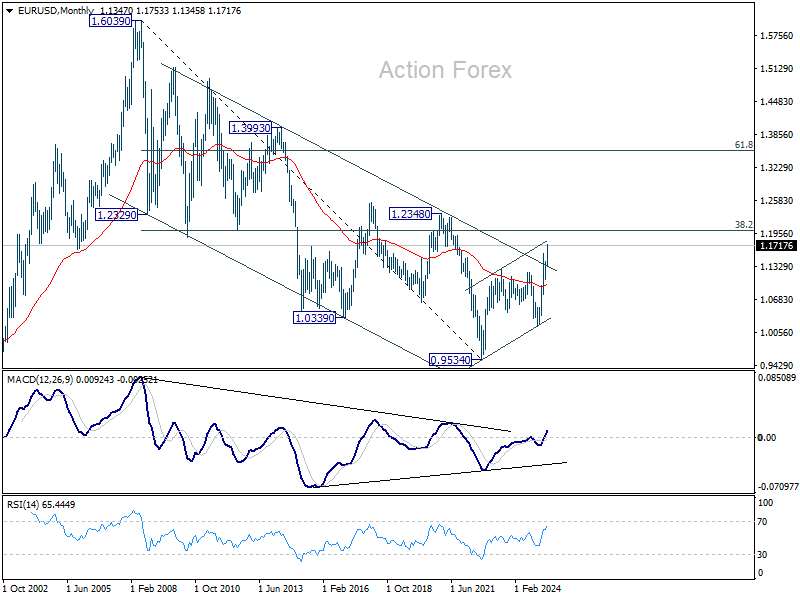
In the long term picture, a long term bottom was in place already at 0.9534, on bullish convergence condition in M MACD. Further rise should be seen to 38.2% retracement of 1.6039 to 0.9534 at 1.2019. Rejection by 1.2019 will keep the price actions from 0.9534 as a corrective pattern. But sustained break of 1.2019 will suggest long term bullish trend reversal, and target 61.8% retracement at 1.3554.