US Dollar dives lower after US GDP and Durable Goods fail to deliver on expectations

- The US Dollar sinks lower and snaps under profit taking ahead of Thanksgiving.
- With Thanksgiving and Black Friday ahead, Wednesday will release three days’s worth of economic data.
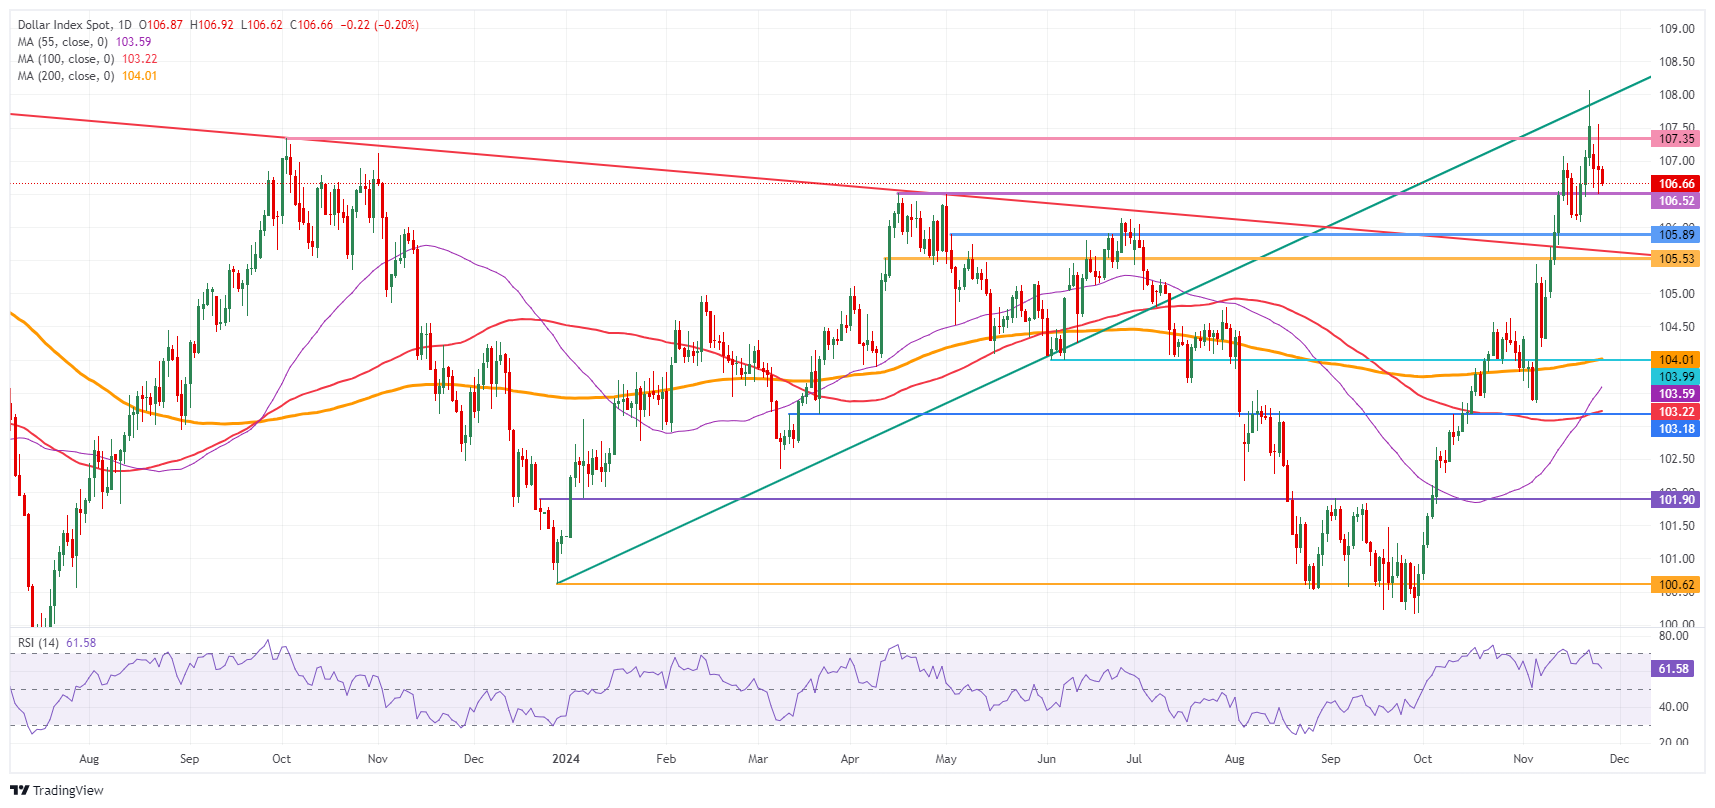
- The US Dollar Index extends this week’s decline and dips to 106.00.
The US Dollar (USD) is dropping lower this Wednesday after some major US economic data points were released. With the shortened trading week, the US Gross Domestic Product, the Durable Goods and the Personal Consumption Expenditures data has been moved up, to Wednesday. The third quarter Gross Domestic Product (GDP) print came in as no surprise and was in line of expectations, where Durable Goods came in at 0.2%, far below the expected 0.5% ahead of the busiest shopping season of the US.
The main pivotal data that remains for this Wednesday is the Personal Consumption Expenditures (PCE) Price Index for October, the preferred inflation gauge for the Federal Reserve (Fed), which could shape expectations about the interest rate outlook for the Fed meeting in December.
Daily digest market movers: Durable Goods steal the show
- Traders were glued to their screens for some major economic data releases on the US economy.
- A revised reading of the US Gross Domestic Product for the third quarter:
- Headline GDP came in as expected at 2.8%.
- The Price Index component ticked up to 1.9%, from the previous 1.8%.
- The PCE segment remained unchanged at 1.5%.
- Weekly Initial Jobless Claims rose by 213,000, much less than the expected 217,000.
- Durable Goods Orders for October fell to 0.2%, below the expected 0.5%. Goods without transportation are flirting with contraction and fell to only 0.1%, where 0.2% was expected.
- A revised reading of the US Gross Domestic Product for the third quarter:
- At 15:00 GMT, the Fed’s preferred inflation gauge will be released, the Personal Consumption Expenditures (PCE) for October:
- The monthly headline PCE is expected to have grown steadily by 0.2%.
- The monthly core PCE should portray a similar picture and show a steady growth of 0.3% compared to the previous month.
- On a yearly basis, the headline inflation is expected to accelerate to 2.3% in October from 2.1% a month earlier. The core PCE is estimated to have risen by 2.8%, stronger than the former release of 2.7%.
- Equities are struggling with both European equities and US futures are falling in red numbers after the US GDP and Durable Goods release.
- The CME FedWatch Tool is pricing in another 25 basis points (bps) rate cut by the Fed at the December 18 meeting by 66.5%. A 33.5% chance is for rates to remain unchanged. The Fed Minutes have helped the rate cut odds for December to move higher.
- The US 10-year benchmark rate trades at 4.25%, substantially lower from the high printed two weeks ago of 4.50% on November 15.
US Dollar Index Technical Analysis: US data fails to confirm
The US Dollar Index (DXY) is softening a touch ahead of the last important data release for this broken week with the Thanksgiving public holiday ahead. Experienced traders will know that it will be nearly impossible to trade on the back of the economic data release with too many moving parts influencing the direction of the Greenback and other asset classes. Besides that, a very valid argument can be made here that the Greenback has had a very profitable rally, with US traders ready to cash in before diving into their turkey.
The fresh two-year high at 108.07 seen on Friday is the first level to beat. Further up, the 109.00 big figure level is the next one in line. The support from October 2023 at 109.36 is certainly a level to watch out for on the topside.
Support comes in around 106.52, the double top from May. A touch lower, the pivotal 105.53 (April 11 high) should avoid any downturns towards 104.00. Should the DXY fall all the way towards 104.00, the big figure and the 200-day Simple Moving Average at 103.98 should catch any falling knife formation.
US Dollar Index: Daily Chart
GDP FAQs
A country’s Gross Domestic Product (GDP) measures the rate of growth of its economy over a given period of time, usually a quarter. The most reliable figures are those that compare GDP to the previous quarter e.g Q2 of 2023 vs Q1 of 2023, or to the same period in the previous year, e.g Q2 of 2023 vs Q2 of 2022. Annualized quarterly GDP figures extrapolate the growth rate of the quarter as if it were constant for the rest of the year. These can be misleading, however, if temporary shocks impact growth in one quarter but are unlikely to last all year – such as happened in the first quarter of 2020 at the outbreak of the covid pandemic, when growth plummeted.
A higher GDP result is generally positive for a nation’s currency as it reflects a growing economy, which is more likely to produce goods and services that can be exported, as well as attracting higher foreign investment. By the same token, when GDP falls it is usually negative for the currency. When an economy grows people tend to spend more, which leads to inflation. The country’s central bank then has to put up interest rates to combat the inflation with the side effect of attracting more capital inflows from global investors, thus helping the local currency appreciate.
When an economy grows and GDP is rising, people tend to spend more which leads to inflation. The country’s central bank then has to put up interest rates to combat the inflation. Higher interest rates are negative for Gold because they increase the opportunity-cost of holding Gold versus placing the money in a cash deposit account. Therefore, a higher GDP growth rate is usually a bearish factor for Gold price.
