US GDP missed estimates in Q1

- US GDP contracted at an annual rate of 0.3% in the January-March period.
- The US Dollar Index trades with decent gains in the 99.30-99.40 band.
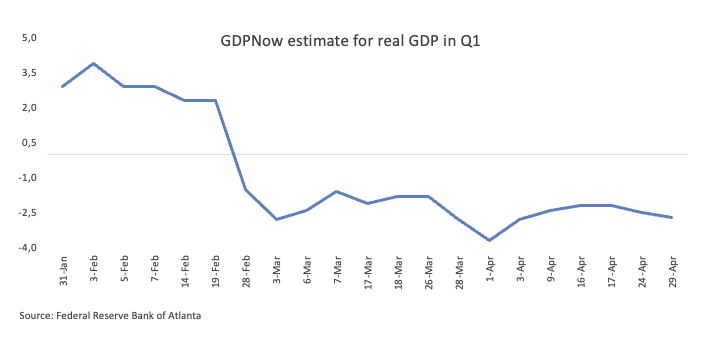
The US economy contracted at an annualised rate of 0.3% in the first quarter of 2025, according to data released Wednesday by the Bureau of Economic Analysis (BEA), missing market forecasts and coming down from the prior 2.4% expansion.
From the BEA’s release: “The decrease in real GDP in the first quarter primarily reflected an increase in imports, which are a subtraction in the calculation of GDP, and a decrease in government spending. These movements were partly offset by increases in investment, consumer spending, and exports… Compared to the fourth quarter, the downturn in real GDP in the first quarter reflected an upturn in imports, a deceleration in consumer spending, and a downturn in government spending that were partly offset by upturns in investment and exports.”
Market reaction
Despite the upbeat data, the US Dollar Index remained in positive territory, hovering above the 99.40 region in the wake of the release.
US Dollar PRICE Today
The table below shows the percentage change of US Dollar (USD) against listed major currencies today. US Dollar was the strongest against the British Pound.
| USD | EUR | GBP | JPY | CAD | AUD | NZD | CHF | |
|---|---|---|---|---|---|---|---|---|
| USD | 0.12% | 0.40% | 0.39% | 0.03% | 0.09% | 0.33% | 0.02% | |
| EUR | -0.12% | 0.29% | 0.26% | -0.10% | -0.05% | 0.22% | -0.08% | |
| GBP | -0.40% | -0.29% | -0.04% | -0.38% | -0.33% | -0.08% | -0.38% | |
| JPY | -0.39% | -0.26% | 0.04% | -0.38% | -0.31% | -0.02% | -0.35% | |
| CAD | -0.03% | 0.10% | 0.38% | 0.38% | 0.06% | 0.30% | 0.00% | |
| AUD | -0.09% | 0.05% | 0.33% | 0.31% | -0.06% | 0.24% | -0.05% | |
| NZD | -0.33% | -0.22% | 0.08% | 0.02% | -0.30% | -0.24% | -0.29% | |
| CHF | -0.02% | 0.08% | 0.38% | 0.35% | -0.00% | 0.05% | 0.29% |
The heat map shows percentage changes of major currencies against each other. The base currency is picked from the left column, while the quote currency is picked from the top row. For example, if you pick the US Dollar from the left column and move along the horizontal line to the Japanese Yen, the percentage change displayed in the box will represent USD (base)/JPY (quote).
This section below was published as a preview of the advanced US Q1 GDP Growth Rate at 8:00 GMT.
- The United States Gross Domestic Product is seen expanding at an annualised rate of 0.4% in Q1.
- Investors will focus on the potential impact of tariffs on the economy.
- The US Dollar looks consolidative in the lower end of its yearly range.
The United States (US) Bureau of Economic (DXY) remains decisively bearish. The index continues to trade beneath its 200-day and 200-week simple moving averages (SMAs), now positioned at 104.48 and 102.70, respectively.
Downside levels remain in focus, with support eyed at 97.92 – the 2025 low marked on April 21 – and 97.68, a key pivot from March 2022. Any upside correction could first target the psychologically significant 100.00 handle, followed by the interim 55-day SMA at 103.64 and the March 26 swing high of 104.68.
Momentum indicators underscore the bearish trend. The Relative Strength Index (RSI) on the daily chart has slipped to around 36, while the Average Directional Index (ADX) has climbed above 55, suggesting growing strength behind the recent downward move.
Economic Indicator
Core Personal Consumption Expenditures – Price Index (MoM)
The Core Personal Consumption Expenditures (PCE), released by the US Bureau of Economic Analysis on a monthly basis, measures the changes in the prices of goods and services purchased by consumers in the United States (US). The PCE Price Index is also the Federal Reserve’s (Fed) preferred gauge of inflation. The MoM figure compares the prices of goods in the reference month to the previous month.The core reading excludes the so-called more volatile food and energy components to give a more accurate measurement of price pressures. Generally, a high reading is bullish for the US Dollar (USD), while a low reading is bearish.
Economic Indicator
Gross Domestic Product Price Index
The Gross Domestic Product (GDP) Price Index, released quarterly by the Bureau of Economic Analysis, measures the change in the prices of goods and services produced in the United States. The prices that Americans pay for imports aren’t included. Changes in the GDP price index are followed as an indicator of inflationary pressures, which may anticipate higher interest rates. A high reading is seen as bullish for the US Dollar (USD), while a low reading is seen as bearish.
