
Australian Dollar holds gains following Wage Price Index data release
- The Australian Dollar holds ground as the US Dollar weakened following softer-than-expected US inflation data.
- Australia’s Wage Price Index rose by 0.9% QoQ in Q1, against the expected 0.8% increase.
- US President Donald Trump described the relationship with China as excellent.
The Australian Dollar (AUD) extends its gains against the US Dollar (USD) on Wednesday after registering more than 1.50% gains in the previous session. The AUD/USD pair strengthened as the US Dollar weakened following softer-than-expected US inflation data.
Australia’s seasonally adjusted Wage Price Index rose by 3.4% year-over-year in Q4 2025, up from a 3.2% increase in Q4 2024 and surpassing market forecasts of a 3.2% gain. This marks a recovery from the prior quarter, which recorded the slowest wage growth since Q3 2022. On a quarterly basis, the index climbed 0.9% in Q1, surpassing the projected 0.8% rise.
Australian Prime Minister Anthony Albanese was sworn in for a second term on Tuesday after a decisive election victory. Key cabinet positions—including treasurer, foreign affairs, defense, and trade—remain unchanged. Albanese is scheduled to attend the inauguration mass of Pope Leo XIV in Rome on Sunday, where he will also meet with leaders such as European Commission President Ursula von der Leyen to discuss trade relations.
US President Donald Trump told Fox News that he is working to gain greater access to China, describing the relationship as excellent and expressing willingness to negotiate directly with President Xi on a potential deal.
Easing global trade tensions have prompted investors to dial back expectations for aggressive interest rate cuts in Australia. Markets now project the Reserve Bank of Australia (RBA) to reduce the cash rate to approximately 3.1% by year-end, a revision from earlier forecasts of 2.85%. Nevertheless, the RBA is still widely expected to proceed with a 25 basis point cut at its upcoming policy meeting.
Australian Dollar receives support as US Dollar struggles following softer inflation data
- The US Dollar Index (DXY), which measures the US Dollar against a basket of six major currencies, is trading lower at around 100.90 at the time of writing. Traders await the US Producer Price Index (PPI) and the University of Michigan’s latest Consumer Sentiment Survey, which are set to be released later in the trading week.
- US Consumer Price Index (CPI) rose by 2.3% year-over-year in April, slightly below the 2.4% increase recorded in March and market expectations of 2.4%. Core CPI—which excludes food and energy—also climbed 2.8% annually, matching both the previous figure and forecasts. On a monthly basis, both headline CPI and core CPI rose by 0.2% in April.
- The US Dollar strengthened following news that the United States and China reached a preliminary agreement to significantly reduce tariffs after productive trade talks over the weekend in Switzerland. Under the deal, US tariffs on Chinese goods will be reduced from 145% to 30%, while China will lower its tariffs on US imports from 125% to 10%—a move broadly viewed as a major step toward de-escalating trade tensions.
- After two days of negotiations aimed at easing trade tensions, both the US and China reported “substantial progress.” China’s Vice Premier He Lifeng described the talks as “an important first step” toward stabilizing bilateral relations.
- Meanwhile, US Treasury Secretary Bessent and Trade Representative Greer called the discussions a constructive move toward narrowing the $400 billion trade imbalance. However, Greer warned later that if the agreement falls through, tariffs on Chinese goods could be reinstated.
- China’s Consumer Price Index (CPI) declined for the third consecutive month in April, falling 0.1% year-on-year, matching both the market forecast and the drop recorded in March, according to data released Saturday by the National Bureau of Statistics. Meanwhile, the Producer Price Index (PPI) contracted 2.7% YoY in April, steeper than the 2.5% drop in March and below the market expectation of a 2.6% decline.
- Australia’s Westpac Consumer Confidence Index rose 2.2% month-on-month to 92.1 in May, recovering from a 6.0% drop in the previous month and marking its third increase this year.
- Australia’s Ai Group Industry Index showed improvement in April, although it marked the 33rd straight month of contraction—particularly driven by weakness in export-reliant manufacturing. These signs of persistent softness have strengthened market expectations that the Reserve Bank of Australia (RBA) may cut its cash rate by 25 basis points to 3.85% later this month.
Australian Dollar could target 0.6500 barrier near six-month highs
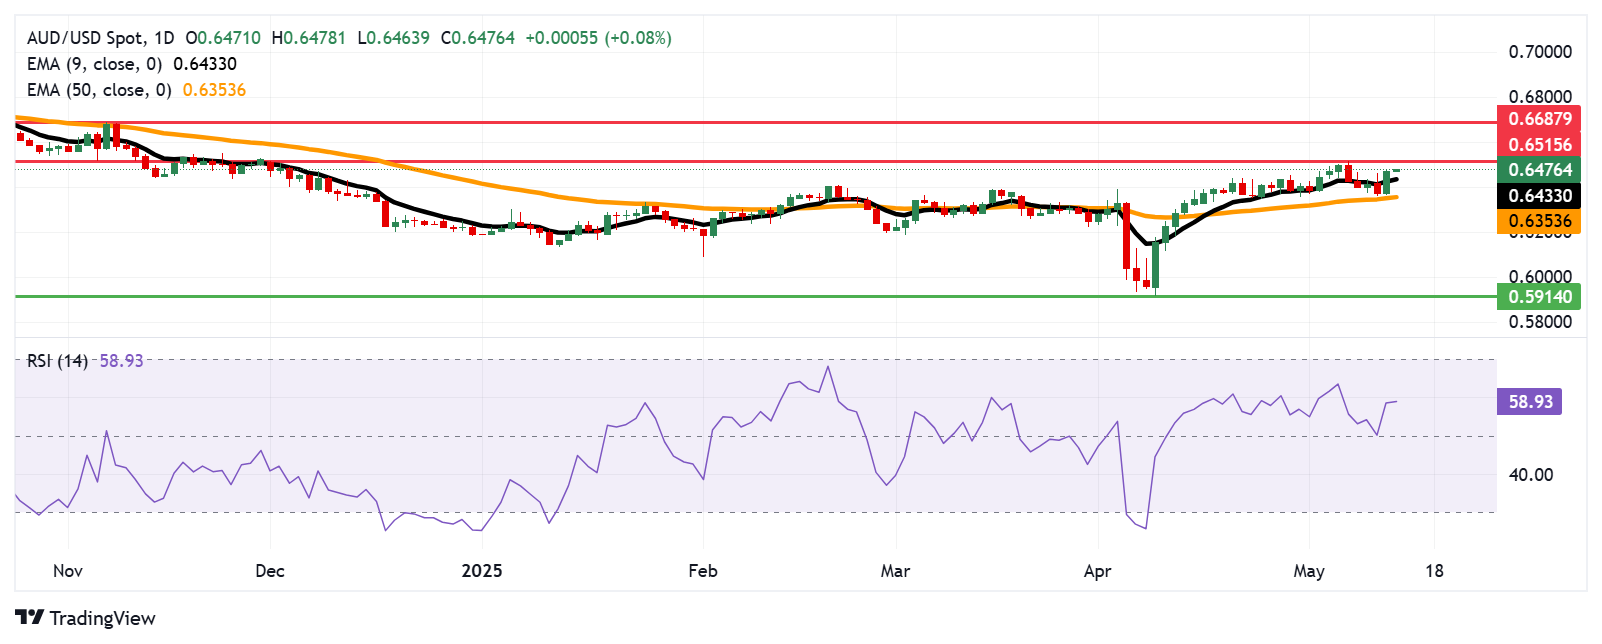
The AUD/USD pair is trading near 0.6470 on Wednesday. Technical analysis of the daily chart indicates a bullish outlook, with the pair trading above the nine-day Exponential Moving Average (EMA). Furthermore, the 14-day Relative Strength Index (RSI) has also surpassed the 50 mark, reinforcing the bullish sentiment.
The AUD/USD pair could retest the six-month high of 0.6515, recorded on December 2, 2024. A sustained break above this level may pave the way for a move toward the seven-month high of 0.6687 from November 2024.
On the downside, the AUD/USD pair is likely to test the nine-day EMA at 0.6433, followed by the 50-day EMA around 0.6353. A decisive break below these levels could weaken the short- and medium-term price momentum and open the door for a decline toward 0.5914, a level not seen since March 2020.
AUD/USD: Daily Chart
Australian Dollar PRICE Today
The table below shows the percentage change of Australian Dollar (AUD) against listed major currencies today. Australian Dollar was the strongest against the US Dollar.
| USD | EUR | GBP | JPY | CAD | AUD | NZD | CHF | |
|---|---|---|---|---|---|---|---|---|
| USD | -0.11% | -0.11% | -0.26% | -0.06% | -0.12% | -0.13% | -0.14% | |
| EUR | 0.11% | 0.00% | -0.20% | 0.05% | -0.01% | -0.04% | -0.03% | |
| GBP | 0.11% | -0.00% | -0.22% | 0.05% | -0.02% | -0.04% | -0.03% | |
| JPY | 0.26% | 0.20% | 0.22% | 0.22% | 0.16% | 0.14% | 0.14% | |
| CAD | 0.06% | -0.05% | -0.05% | -0.22% | -0.07% | -0.07% | -0.07% | |
| AUD | 0.12% | 0.01% | 0.02% | -0.16% | 0.07% | -0.00% | -0.01% | |
| NZD | 0.13% | 0.04% | 0.04% | -0.14% | 0.07% | 0.00% | -0.01% | |
| CHF | 0.14% | 0.03% | 0.03% | -0.14% | 0.07% | 0.01% | 0.00% |
The heat map shows percentage changes of major currencies against each other. The base currency is picked from the left column, while the quote currency is picked from the top row. For example, if you pick the Australian Dollar from the left column and move along the horizontal line to the US Dollar, the percentage change displayed in the box will represent AUD (base)/USD (quote).
Economic Indicator
Wage Price Index (QoQ)
The Wage Price Index released by the Australian Bureau of Statistics is an indicator of labor cost inflation and of the tightness of labor markets. The Reserve Bank of Australia pays close attention to it when setting interest rates. A high reading is positive (or bullish) for the AUD, while a low reading is seen as negative (or bearish).