IONQ Elliott Wave technical analysis [Video]
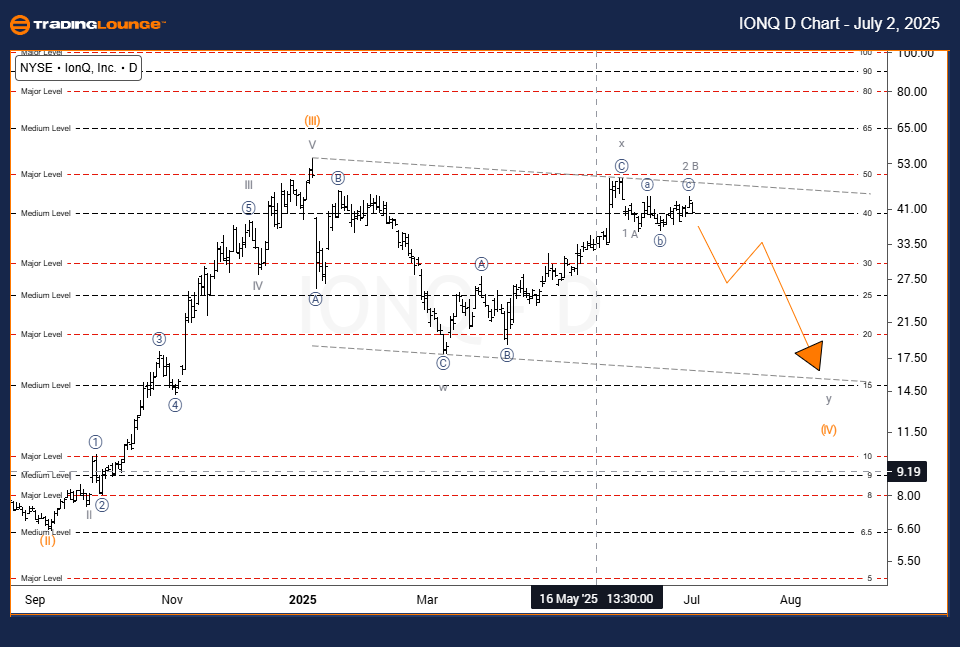
IONQ Elliott Wave analysis
Function: Counter Trend.
Mode: Corrective.
Structure: Corrective.
Position: Wave A of y.
Direction: Downside in Wave C
Details: Price targeting $25 and then $20 as Wave C nears completion.
In the daily timeframe, IonQ, Inc. (IONQ) is advancing through the final stages of its corrective structure. Wave C, within Wave y, is leading the price toward the $25 level, and potentially to $20. This movement suggests the conclusion of a larger corrective phase may be near. As Wave B finishes, a decline in Wave C is likely to follow, setting up a possible short-term bearish opportunity.
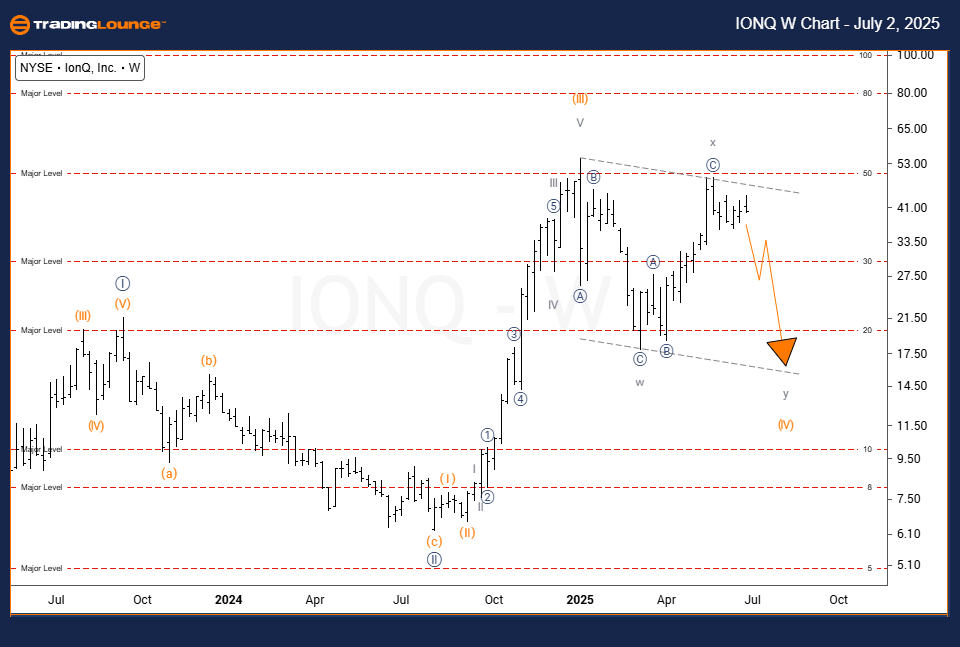
IONQ Elliott Wave analysis
Function: Counter Trend.
Mode: Corrective.
Structure: Corrective.
Positino: Wave y of (IV).
Direction: Downside into Wave y.
Details: Wave y has reached 100% of Wave w’s length, indicating maturity.
The weekly chart for IonQ shows a mature corrective structure forming as Wave y of Wave (IV) nears completion. The stock has achieved a price extension equaling 100% of Wave w, a common threshold signaling a possible end to the correction. While the overarching trend remains bullish, this area could mark a short-term bottom. Traders should monitor price behavior for potential support and signs of a new impulse move.