
US Dollar Slumps as Trump eyes Powell’s removal, PPI misses forecast
- The US Dollar slumps on Wednesday after CBS reported Trump asked GOP lawmakers if he should fire Fed Chair Jerome Powell.
- US President Donald Trump finalized a trade deal with Indonesia on Tuesday, imposing a 19% tariff on Indonesian exports.
- June CPI data came in mixed, but the report confirmed the inflationary effect of tariffs and curbed hopes of Fed interest-rate cuts.
The US Dollar slumps on Wednesday after CBS reported that US President Donald Trump asked a group of House Republicans whether he should fire Federal Reserve Chair Jerome Powell. The news offsets earlier gains triggered by softer-than-expected US Producer Price Index (PPI) data for June, which initially lifted the Greenback amid signs of easing producer inflation.
At the time of writing, and an extended tariff negotiation window, which helped ease geopolitical uncertainty.
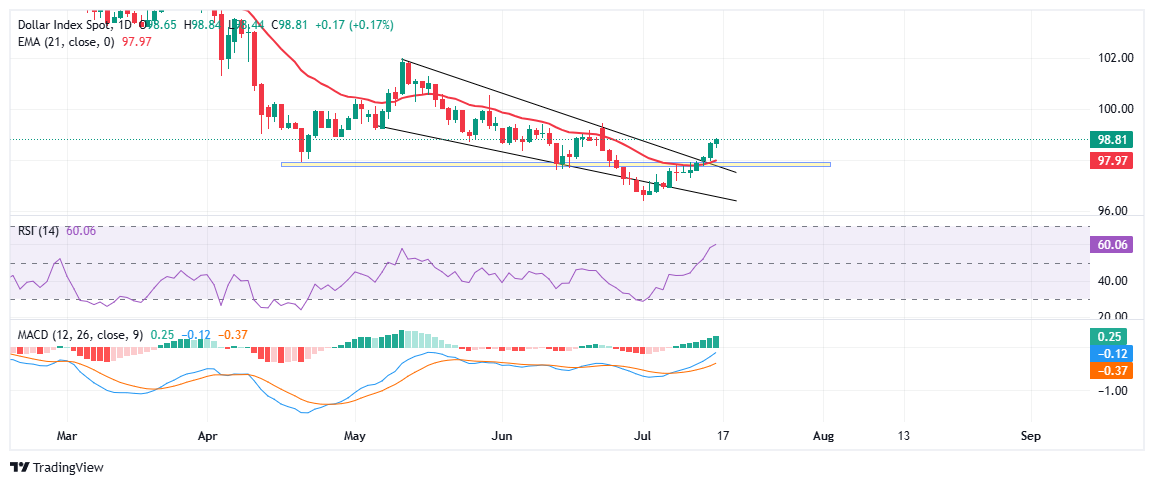
The index broke decisively above the 97.80-98.00 resistance zone following the latest US CPI report, above the upper boundary of the falling wedge pattern.
The DXY is trading below its 50-day EMA, which stands near 98.77, acting as immediate resistance. A clear breakout above this level on a daily closing basis would likely trigger a push toward the June 23 high at 99.42. The 9-day EMA at 97.97 now serves as initial dynamic support, while the 98.00-97.80 zone offers a strong base in case of pullbacks.
On the momentum front, the Relative Strength Index (RSI) has climbed to around 57, maintaining a steady position above the neutral 50 level. A sustained push above 60 would reinforce bullish conviction and signal acceleration in buying pressure.
Meanwhile, the Moving Average Convergence Divergence (MACD) remains positive, with the MACD line staying above the signal line. The histogram bars are expanding, indicating increasing bullish momentum.
US Dollar PRICE Today
The table below shows the percentage change of US Dollar (USD) against listed major currencies today. US Dollar was the strongest against the New Zealand Dollar.
| USD | EUR | GBP | JPY | CAD | AUD | NZD | CHF | |
|---|---|---|---|---|---|---|---|---|
| USD | -0.64% | -0.52% | -1.03% | -0.25% | -0.38% | -0.09% | -0.43% | |
| EUR | 0.64% | 0.14% | -0.41% | 0.40% | 0.22% | 0.51% | 0.24% | |
| GBP | 0.52% | -0.14% | -0.54% | 0.28% | 0.10% | 0.37% | 0.10% | |
| JPY | 1.03% | 0.41% | 0.54% | 0.78% | 0.72% | 0.93% | 0.66% | |
| CAD | 0.25% | -0.40% | -0.28% | -0.78% | -0.14% | 0.05% | -0.19% | |
| AUD | 0.38% | -0.22% | -0.10% | -0.72% | 0.14% | 0.26% | -0.01% | |
| NZD | 0.09% | -0.51% | -0.37% | -0.93% | -0.05% | -0.26% | -0.28% | |
| CHF | 0.43% | -0.24% | -0.10% | -0.66% | 0.19% | 0.01% | 0.28% |
The heat map shows percentage changes of major currencies against each other. The base currency is picked from the left column, while the quote currency is picked from the top row. For example, if you pick the US Dollar from the left column and move along the horizontal line to the Japanese Yen, the percentage change displayed in the box will represent USD (base)/JPY (quote).