
Australian Dollar edges lower despite China’s Caixin Services PMI rises in July
- The Australian Dollar remains under pressure despite improved domestic S&P PMI data.
- China’s Caixin Services PMI rose to 52.6 in July, against the expected 50.2.
- Fed Governor Adriana Kugler’s resignation has given Trump an earlier-than-expected opportunity to influence the direction of the central bank.
The Australian Dollar (AUD) loses ground for the second successive day despite the release of improved S&P Purchasing Managers’ Index (PMI) data on Tuesday. The AUD/USD pair depreciates as the US Dollar (USD) remains steady, driven by the latest global trade developments and shifting expectations for monetary policy.
The S&P Global Australia Composite PMI climbed to 53.8 in July from 51.6 in June, signaling a tenth consecutive monthly rise in business activity and the strongest expansion in private sector activity since April 2022. Meanwhile, Services PMI Business Activity Index rose to 54.1 in July from 51.8 in June, marking the highest level since March 2024.
China’s Caixin Services Purchasing Managers’ Index unexpectedly jumped to 52.6 in July from 50.6 in June. The market forecast was for a 50.2 print in the reported period.
The Reserve Bank of Australia (RBA) is expected to deliver a 25 basis point rate cut next week, which would bring the cash rate down to 3.60%. The case for easing has grown stronger as core inflation slowed to 2.7% in June, well within the RBA’s 2–3% target, along with rising unemployment and slowing wage growth.
Australian Dollar struggles as US Dollar steadies ahead of ISM Services PMI
- The US Dollar Index (DXY), which measures the value of the US Dollar against six major currencies, is gaining ground for the second successive day and trading around 98.80 at the time of writing. The US ISM Services Purchasing Managers Index (PMI) will take center stage later in the North American session.
- US Federal Reserve (Fed) Governor Adriana Kugler has given an unexpected resignation, which has provided US President Donald Trump an earlier-than-anticipated opportunity to influence the central bank. This development has raised concerns about the Fed’s independence.
- The Trump administration dismissed Bureau of Labor Statistics (BLS) Commissioner Erika McEntarfer after the weaker-than-expected jobs report. This action could be a broader strategy to undermine the credibility of official inflation data, with potential implications for markets and Fed policy debates.
- Nonfarm Payrolls (NFP) in the United States (US) rose by 73,000 in July, compared to a 14,000 increase (revised from 147,000) seen in June. This figure came in weaker than the market expectation of 110,000. Additionally, the Unemployment Rate ticked higher to 4.2% in July from 4.1% in June, as expected.
- President Trump signed an executive order on Thursday, imposing tariffs ranging from 10% to 41%, set to go into effect on August 1, on US imports from dozens of countries and foreign locations, including Canada, India, and Taiwan, that failed to reach the trade deals deadline, per Reuters.
- The Federal Reserve (Fed) decided to hold its benchmark federal funds rate in a range of 4.25%-4.5% at its July meeting on Wednesday, as widely expected. Fed Chair Jerome Powell said in a post-policy conference that the US central bank has “made no decisions” about a potential policy change in September, and it may take a bit to assess the effect of tariffs on consumer prices.
- The US and China were unable to reach an agreement on extending the 90-day tariff pause during their latest round of talks in Stockholm, Sweden. The current pause is set to expire on August 12, with the final decision resting in the hands of US President Donald Trump. In the meantime, US tariffs have been lowered from 145% to 30%, while Chinese tariffs have been reduced from 125% to 10%.
- TD-MI Inflation Gauge rose 0.9% month-over-month in July, following June’s modest 0.1% rise and marking the sharpest rise since December 2023. Meanwhile, the annual inflation gauge remained consistent at a 2.4% increase. The monthly increase adds to the Reserve Bank of Australia’s (RBA) concerns amid continued uncertainty in supply chains and consumer demand.
- Australia was spared from the latest United States (US) tariff hikes, indicating that President Donald Trump had left the 10% baseline tariffs on Australian goods unchanged. Moreover, a weaker United States (US) jobs report prompted market reaction to price in two interest rate cuts by the Federal Reserve (Fed).
Australian Dollar remains subdued near 0.6450 amid a persistent bearish bias
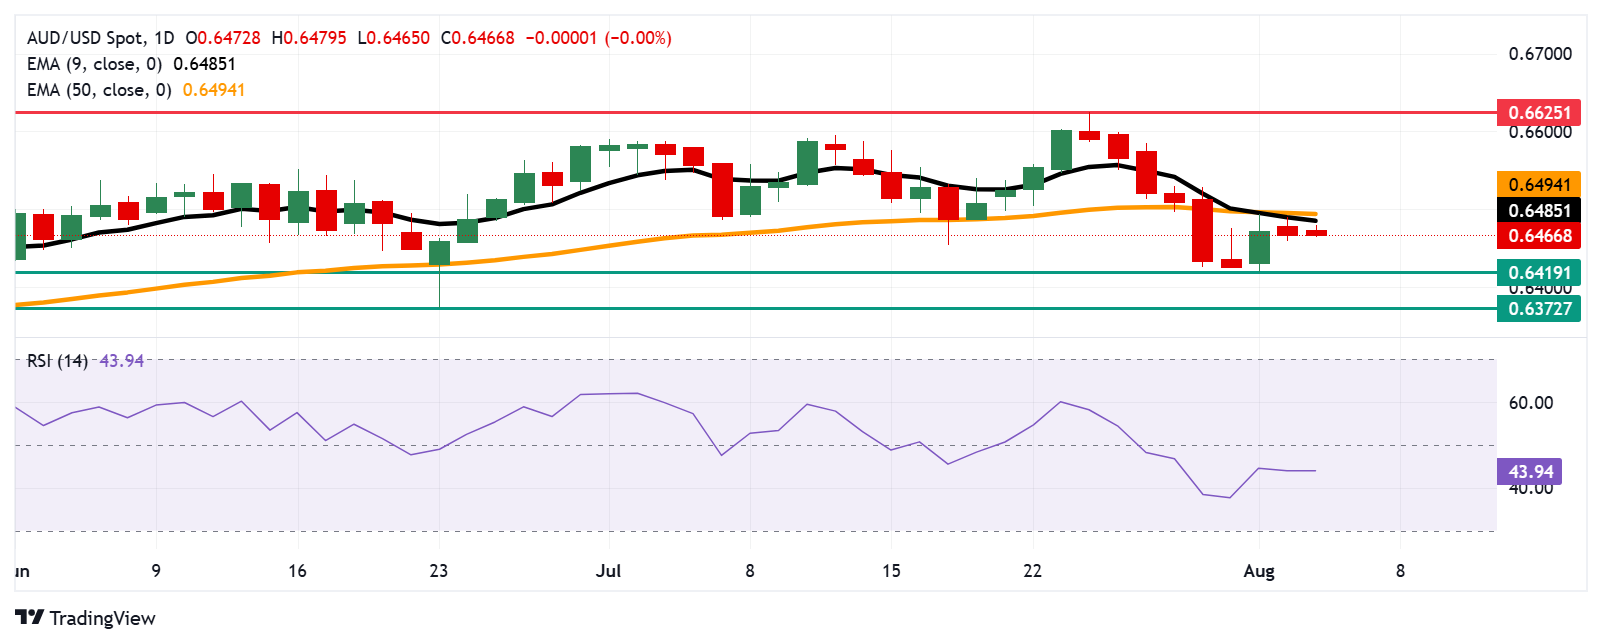
The AUD/USD pair is trading around 0.6470 on Tuesday. Technical analysis on the daily chart suggests a bearish bias, with the 14-day Relative Strength Index (RSI) holding below the 50 level. The pair is also positioned below the nine-day Exponential Moving Average (EMA), signaling weakening short-term momentum.
On the downside, the primary support appears at the two-month low of 0.6419, which was recorded on August 1. A break below this level could put downward pressure on the AUD/USD pair to test a three-month low at 0.6372, recorded on June 23.
The AUD/USD pair could approach the initial barrier at the nine-day EMA of 0.6485, aligned with the 50-day EMA of 0.6494. A break above these levels could strengthen the short- and medium-term price momentum and support the pair to explore the region around the nine-month high at 0.6625.
AUD/USD: Daily Chart
Australian Dollar PRICE Today
The table below shows the percentage change of Australian Dollar (AUD) against listed major currencies today. Australian Dollar was the weakest against the Japanese Yen.
| USD | EUR | GBP | JPY | CAD | AUD | NZD | CHF | |
|---|---|---|---|---|---|---|---|---|
| USD | 0.11% | 0.02% | 0.04% | 0.07% | 0.19% | 0.30% | 0.24% | |
| EUR | -0.11% | -0.10% | -0.03% | -0.03% | -0.01% | 0.12% | 0.12% | |
| GBP | -0.02% | 0.10% | 0.02% | 0.06% | 0.10% | 0.22% | 0.10% | |
| JPY | -0.04% | 0.03% | -0.02% | 0.02% | 0.22% | 0.23% | 0.17% | |
| CAD | -0.07% | 0.03% | -0.06% | -0.02% | 0.06% | 0.16% | 0.04% | |
| AUD | -0.19% | 0.00% | -0.10% | -0.22% | -0.06% | 0.17% | 0.00% | |
| NZD | -0.30% | -0.12% | -0.22% | -0.23% | -0.16% | -0.17% | -0.06% | |
| CHF | -0.24% | -0.12% | -0.10% | -0.17% | -0.04% | -0.01% | 0.06% |
The heat map shows percentage changes of major currencies against each other. The base currency is picked from the left column, while the quote currency is picked from the top row. For example, if you pick the Australian Dollar from the left column and move along the horizontal line to the US Dollar, the percentage change displayed in the box will represent AUD (base)/USD (quote).
Australian Dollar FAQs
One of the most significant factors for the Australian Dollar (AUD) is the level of interest rates set by the Reserve Bank of Australia (RBA). Because Australia is a resource-rich country another key driver is the price of its biggest export, Iron Ore. The health of the Chinese economy, its largest trading partner, is a factor, as well as inflation in Australia, its growth rate and Trade Balance. Market sentiment – whether investors are taking on more risky assets (risk-on) or seeking safe-havens (risk-off) – is also a factor, with risk-on positive for AUD.
The Reserve Bank of Australia (RBA) influences the Australian Dollar (AUD) by setting the level of interest rates that Australian banks can lend to each other. This influences the level of interest rates in the economy as a whole. The main goal of the RBA is to maintain a stable inflation rate of 2-3% by adjusting interest rates up or down. Relatively high interest rates compared to other major central banks support the AUD, and the opposite for relatively low. The RBA can also use quantitative easing and tightening to influence credit conditions, with the former AUD-negative and the latter AUD-positive.
China is Australia’s largest trading partner so the health of the Chinese economy is a major influence on the value of the Australian Dollar (AUD). When the Chinese economy is doing well it purchases more raw materials, goods and services from Australia, lifting demand for the AUD, and pushing up its value. The opposite is the case when the Chinese economy is not growing as fast as expected. Positive or negative surprises in Chinese growth data, therefore, often have a direct impact on the Australian Dollar and its pairs.
Iron Ore is Australia’s largest export, accounting for $118 billion a year according to data from 2021, with China as its primary destination. The price of Iron Ore, therefore, can be a driver of the Australian Dollar. Generally, if the price of Iron Ore rises, AUD also goes up, as aggregate demand for the currency increases. The opposite is the case if the price of Iron Ore falls. Higher Iron Ore prices also tend to result in a greater likelihood of a positive Trade Balance for Australia, which is also positive of the AUD.
The Trade Balance, which is the difference between what a country earns from its exports versus what it pays for its imports, is another factor that can influence the value of the Australian Dollar. If Australia produces highly sought after exports, then its currency will gain in value purely from the surplus demand created from foreign buyers seeking to purchase its exports versus what it spends to purchase imports. Therefore, a positive net Trade Balance strengthens the AUD, with the opposite effect if the Trade Balance is negative.