Swiss Franc Rally Signals Deepening Market Unease – Action Forex
Global markets ended the week with an uneasy calm, masking what appears to be growing stress beneath the surface. Wall Street showed resilience — the major indexes finished higher after mid-week volatility sparked by renewed concerns over regional bank stability. Yet in Europe, sentiment was more fragile, as bank-led declines weighed on both the FTSE 100 and DAX, revealing how quickly confidence can fray.
The contrast highlights a fragile equilibrium between calmness and fear. Investors were torn between the optimism on Fed easing and mounting macro risks — from U.S.–China trade frictions and the prolonged government shutdown to signs of creeping credit stress at smaller U.S. lenders. The fact that Gold pushed to fresh record highs and Swiss Franc surged to the top of the performance board speaks volumes about the underlying bid for safety. Meanwhile, the sharp fall in U.S. 10-year yields through the 4% mark reinforced the notion that capital is seeking shelter rather than return.
Overall, the global setup looks increasingly fragile. While the surface tone remains calm, the cross-currents beneath — spanning banks, trade, and policy uncertainty — suggest that volatility could intensify with little warning.
Regional Bank Troubles Rekindle Credit Market Anxiety
Concerns over U.S. regional banks erupted again last week, unnerving markets already on edge from trade tensions and fiscal paralysis in Washington. The spark came from reports that Zions Bancorporation and Western Alliance had disclosed a series of bad loans and potential fraud-related losses, reigniting long-dormant fears about the quality of regional lenders’ balance sheets. The headlines quickly triggered a sector-wide selloff, spreading unease far beyond the institutions directly involved.
The scale of the reaction underscored just how fragile market confidence has become. The shadow of the 2023 mini banking crisis still looms large — the sudden collapse of Silicon Valley Bank and its peers remains a reference point whenever credit stress reappears. The psychological scars have yet to heal.
Adding to the nervousness is a growing perception that credit standards may have loosened too much during the last phase of the U.S. rate cycle. With the Fed now easing policy and funding costs declining, some investors worry that banks could again be tempted to stretch risk tolerance in commercial and real-estate lending. Any new evidence of weakness could easily reignite fears of a wider solvency problem.
For now, the problems appear localized. Still, markets are clearly pricing in the possibility that hidden losses on loan books. The very fact that relatively small lenders can shake the entire financial complex reflects a deeper unease about transparency and trust.
The episode also reinforces why safe-haven demand surged across assets. Gold’s record-breaking rally above 4300, the Franc’s powerful appreciation, and a sharp drop in U.S. 10-year yields all signal that investors are quietly shifting toward capital preservation.
DOW Holds Ground, But Momentum Clearly Fading
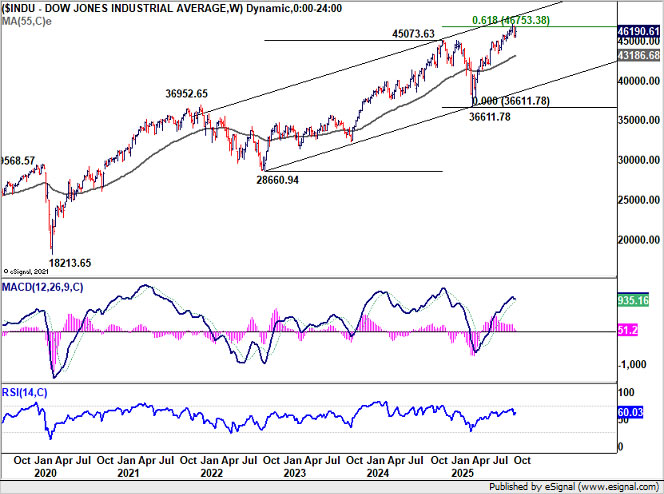
DOW managed to hold its ground through another volatile week, displaying resilience that contrasts with the unease seen elsewhere in global markets. Buyers repeatedly stepped in near 55 D EMA (now at 45,591.87), preventing deeper losses and maintaining a choppy sideways pattern. Yet, despite this apparent stability, the index is showing clear signs of fatigue after its record-setting.
Technically, loss of momentum is unmistakable with bearish divergence in D MACD. Additionally, DOW’s inability to make a clean break through 61.8% projection of 28,660.94 to 45,073.63 from 36,611.87 at 46,753.38 suggests that the rally may be reaching exhaustion.
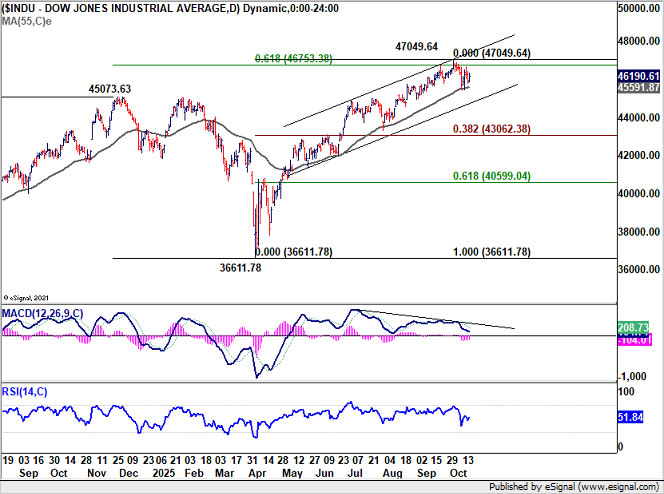
For now, 55 Day EMA is the key short-term pivot. Firm break below this level would confirm rejection from the 46,753.38 projection barrier and shift near-term risk to the downside. That would open the way for deeper correction toward near term rising channel support (near 44,000). Further break of the channel support will pave the way back to 38.2% retracement of 36611.78 to 47049.64 at 43062.38.
Bond Market Sends Warning Signal as 10-Year Yield Breaks 4% Again
U.S. 10-year Treasury yield has breached the 4% psychological level again last week. The recent down trend could partly be attributed to expectations of Fed easing. Yet, the trigger of the current downleg is clearly the worries over regional banking exposures.
Technically, break of 3.992 support confirmed resumption of the decline from 4.629. Next target is 61.8% projection of 4.493 to 3.992 from 4.200 at 3.891.
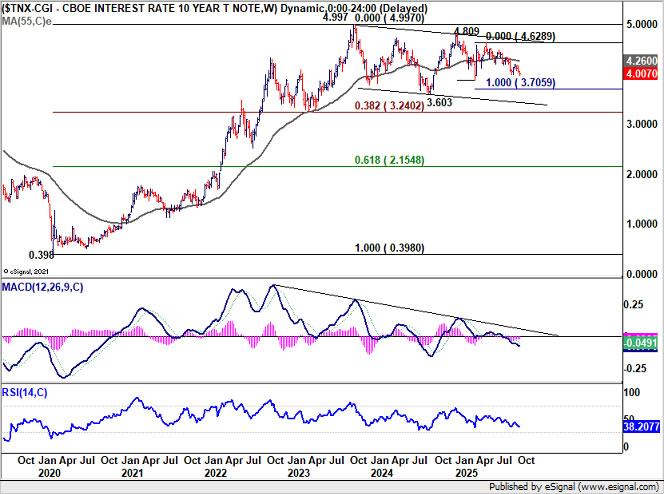
If the 3.891 floor fails to hold, the next destination would be 3.700, a dual Fibonacci projections zone with 100% projection at 3.699 and 100% projection of 4.809 to 3.886 from 4.629 at 3.705.
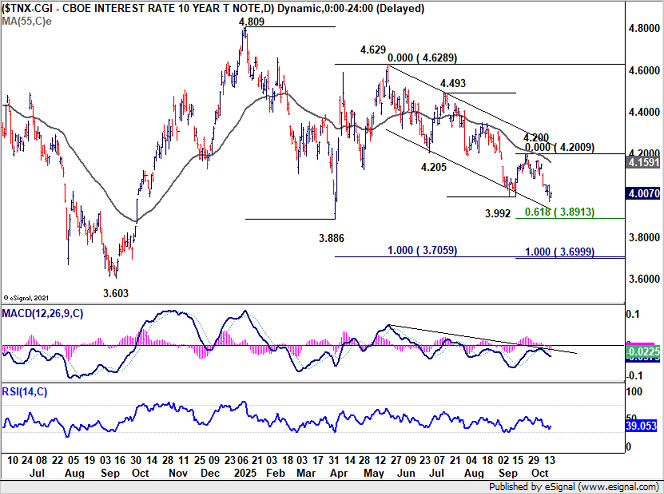
So, if 10-year yield stabilizes above 3.9%, it could mark a temporary reprieve as short-term panic unwinds. However, decisive break below that zone would risk turning this into a broader confidence event, one that could spill over into other assets.
FTSE Suffers Sharp Pullback, DAX Outlook Even Worse
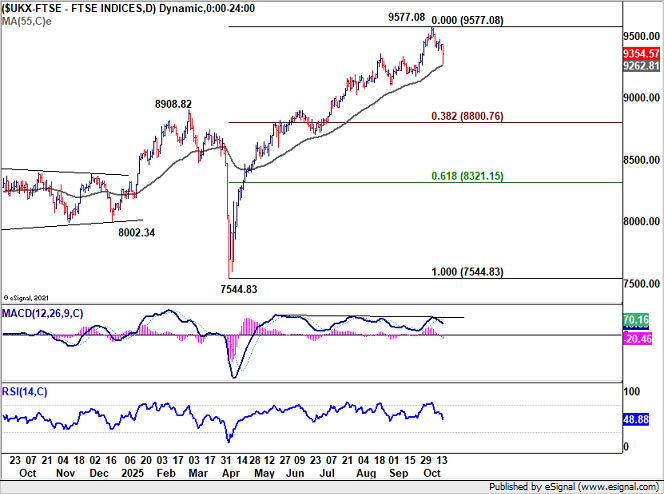
Friday’s selloff in FTSE was clearly worse than DOW even though it managed to close paring much of the earlier declines. Near term focus would be on whether 55 D EMA (now at 9262.81) could hold. Sustained break there will argue that fall from 9577.08 is already correcting the whole rise from 7544.83. In this case, deeper decline would be seen towards 38.2% retracement of 7544.83 to 9577.08 at 8800.76.
Strong bounce from current level would keep near term outlook bullish for another rise through 9577.08 high. But considering mild bearish divergence condition in D MACD, upside potential could be relatively limited in this case.
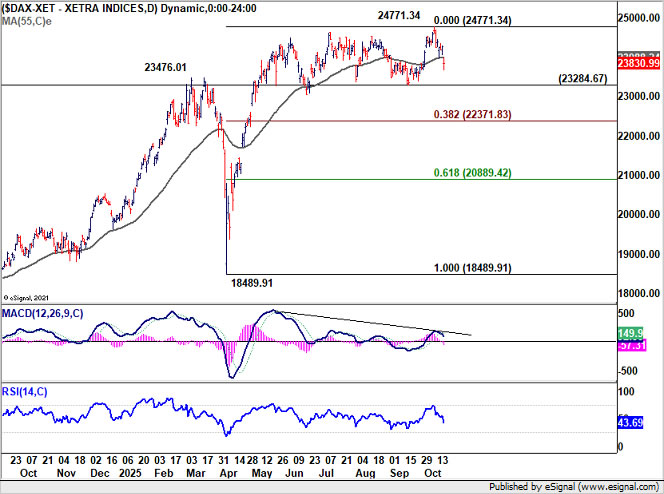
German DAX has come under even heavier pressure than its UK counterpart. Clear bearish divergence condition in D MACD and the close below 55 D EMA (now at 23988.24), suggests that decline is probably imminent.
Fall from 24771.34 might be correcting the whole rise from 18489.91. Firm break of 23284.67 support should confirm this bearish case, and target 38.2% retracement of 18489.91 to 24771.34.
Franc Surges as Safe-Haven Flows Intensify
Swiss Franc has reasserted itself as the market’s preferred refuge, surging across the board as investors rushed into safety . The move was most pronounced in European crosses, where technical breaks confirmed that the Franc’s strength is far from over.
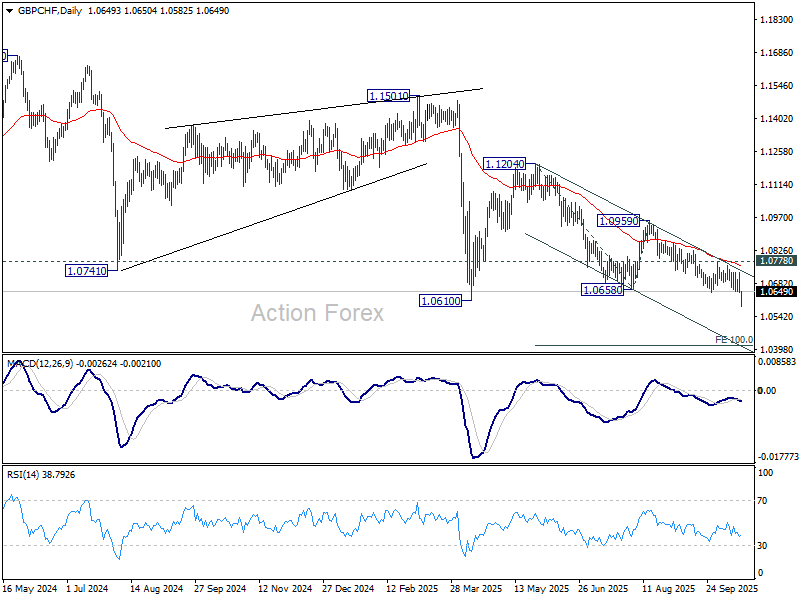
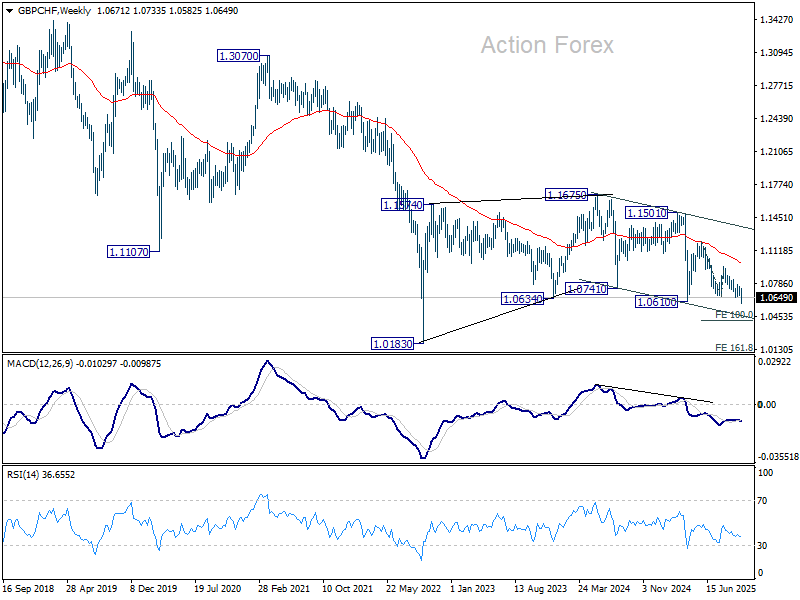
In GBP/CHF, the collapse through 1.0610/58 cemented the cross’s bearish structure, confirming resumption of the downtrend from 1.1675. As long as 1.0778 resistance caps recovery attempts, outlook remains firmly bearish. Next target is 100% projection of 1.1204 to 1.0658 from 1.0959 at 1.0413. Break beneath that could accelerate losses toward 1.0183, a level last seen during the 2022 risk-off wave.
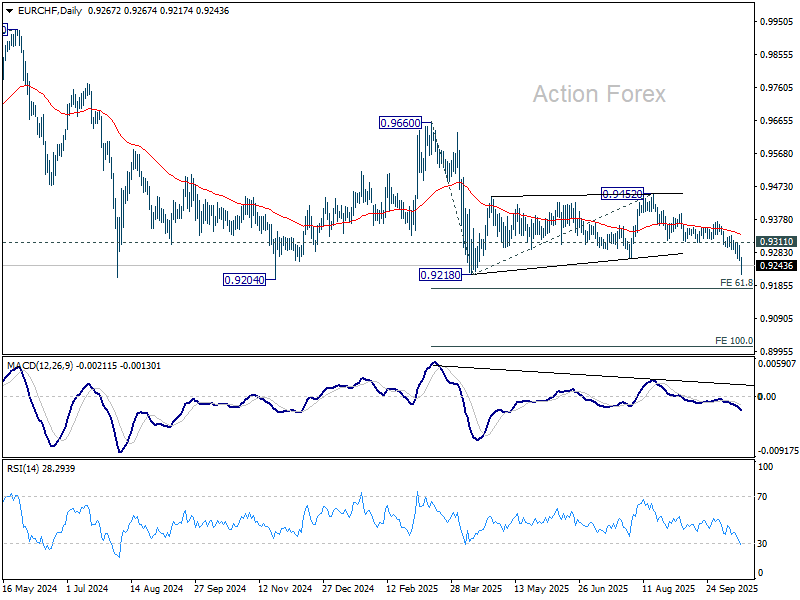
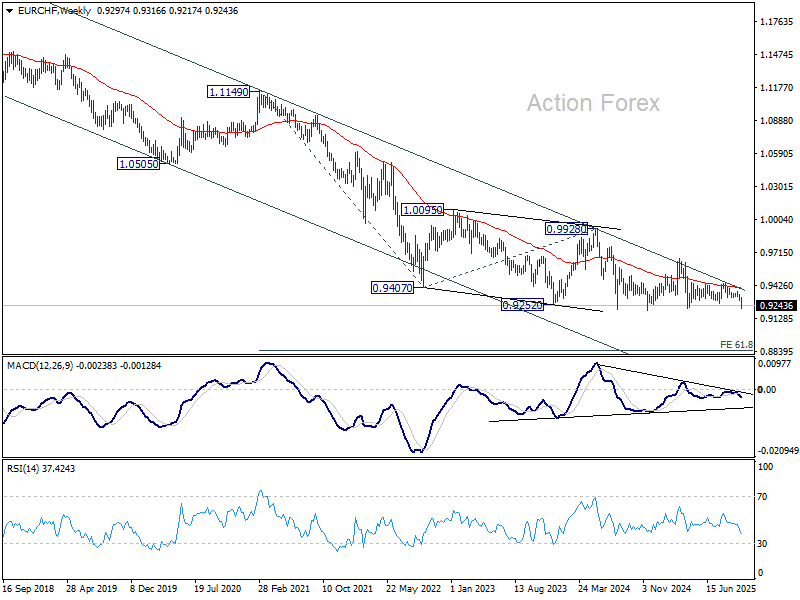
EUR/CHF is still holding above 0.9204 low, but the late selloff still suggests that larger down trend is resuming. Further decline is expected as long as 0.9311 support turned resistance holds, even in case of recovery. Next target is 61.8% projection of 0.9660 to 0.9218 from 0.9452 at 0.9179. Firm break there will target 100% projection at 0.9010.
The depth and speech of the decline in GBP/CHF and EUR/CHF could depend on how FTSE and DAX flare next.
For USD/CHF, the near term picture is less clear. Rebound from 0.7828 has completed well ahead of 0.8170 resistance, and that keeps overall outlook bearish. However, the corrective pattern from 0.7828 could still extend with another rising leg.
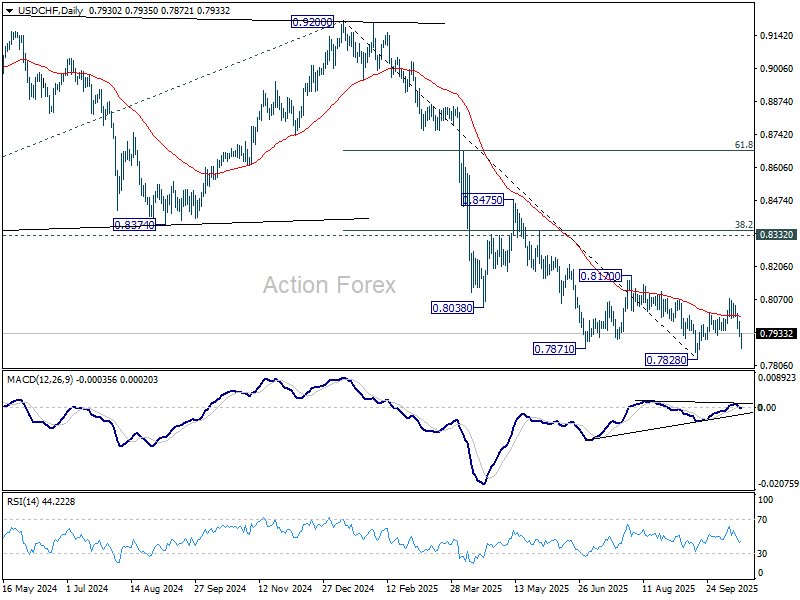
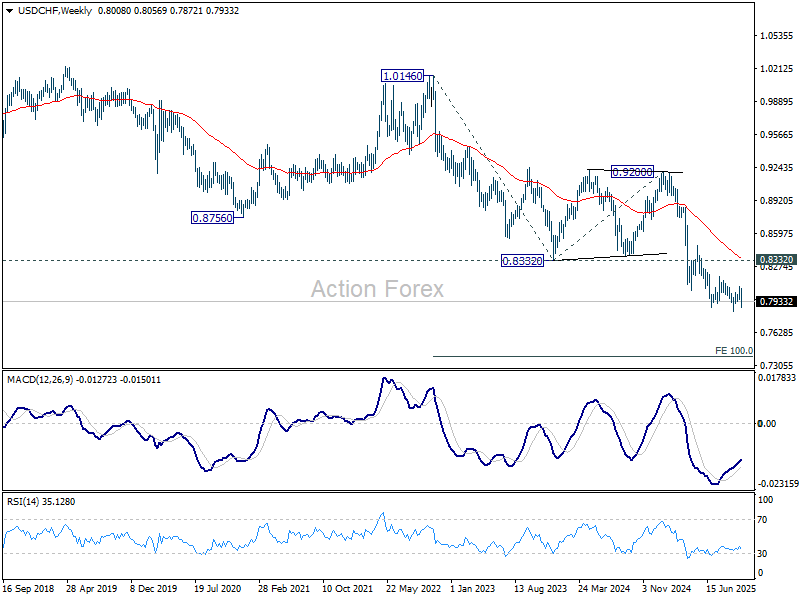
Whether USD/CHF is ready to break through 0.7828 might hinge on the next move in US 10-year yield, if it could quickly stabilize back above 4.000 mark, or dive through 3.9000 towards 3.7000. But in either case, USD/CHF should target 100% projection of 1.0146 (2022 high) to 0.8332 from 0.9200 at 0.7382 in the medium term. It’s just a matter of time.
Dollar Index: Another bounce still possible as correction extends
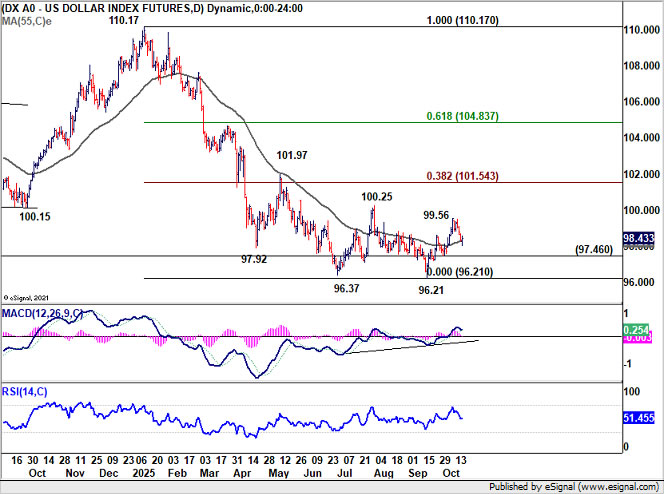
As for Dollar Index, rebound from 96.21 has clearly lost momentum after hitting 99.56. still, with 97.46 support intact, further rise will remain in favor. Break of 99.56 will target 100.25 and possibly above.
However, such rebound is tentatively seen as a corrective move only. Hence, strong resistance is expected from 38.2% retracement of 110.17 to 96.21 at 101.54 to limit upside.
Meanwhile, firm break of 97.46 support will argue that the rebound has completed and bring retest of 96.21 low.
AUD/USD Weekly Report
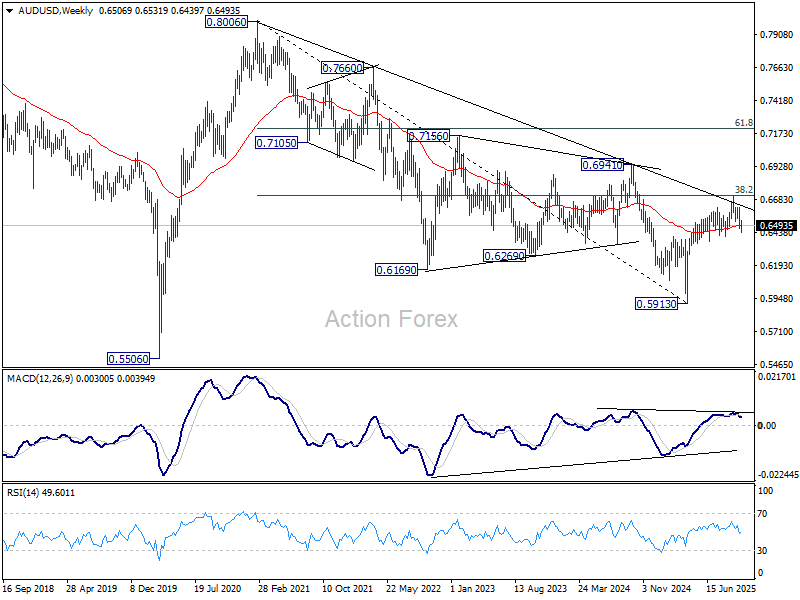
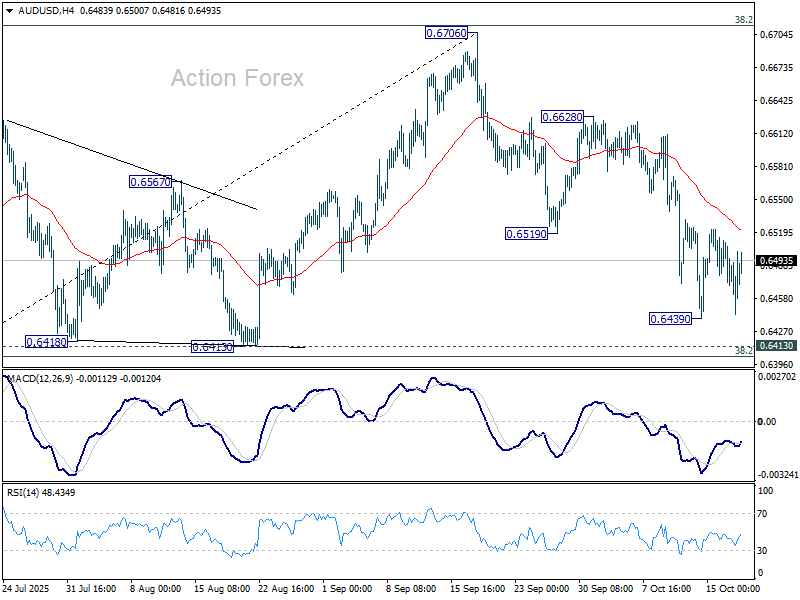
AUD/USD’s fall from 0.6706 extended lower to 0.6439 last week but turned sideway. Initial bias stays neutral this week first. Further decline is in favor as long as 55 D EMA (now at 0.6545) holds. Below 0.6439 will target 0.6413 cluster support (38.2% retracement of 0.5913 to 0.6706 at 0.6403. Decisive break there will indicate bearish reversal after rejection by 0.6713 fibonacci level. Nevertheless, sustained trading above 55 D EMA will keep the rise from 0.5913 intact, and bring retest of 0.6706 high.
In the bigger picture, there is no clear sign that down trend from 0.8006 (2021 high) has completed. Rebound from 0.5913 is seen as a corrective move. Outlook will remain bearish as long as 38.2% retracement of 0.8006 to 0.5913 at 0.6713 holds. Nevertheless, considering bullish convergence condition in W MACD, sustained break of 0.6713 will be a strong sign of bullish trend reversal, and pave the way to 0.6941 structural resistance for confirmation.
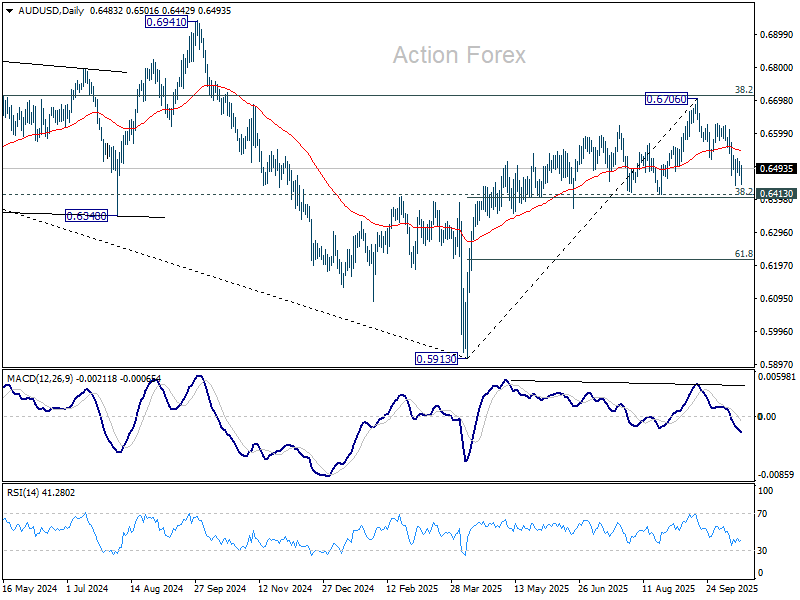
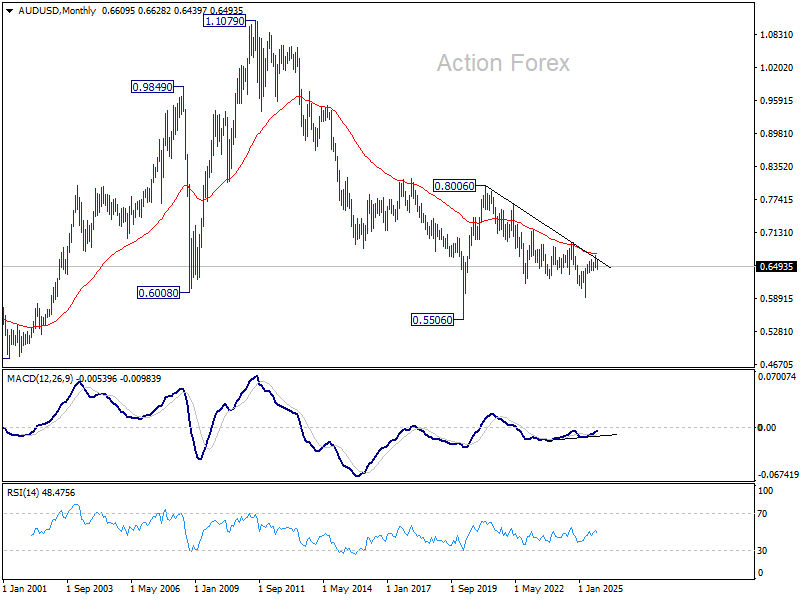
In the long term picture, fall from 0.8006 is seen as the second leg of the corrective pattern from 0.5506 long term bottom (2020 low). Hence, in case of deeper decline, strong support should emerge above 0.5506 to contain downside to bring reversal. On the upside, firm break of 0.6941 will argue that the third leg has already started back to 0.8006.