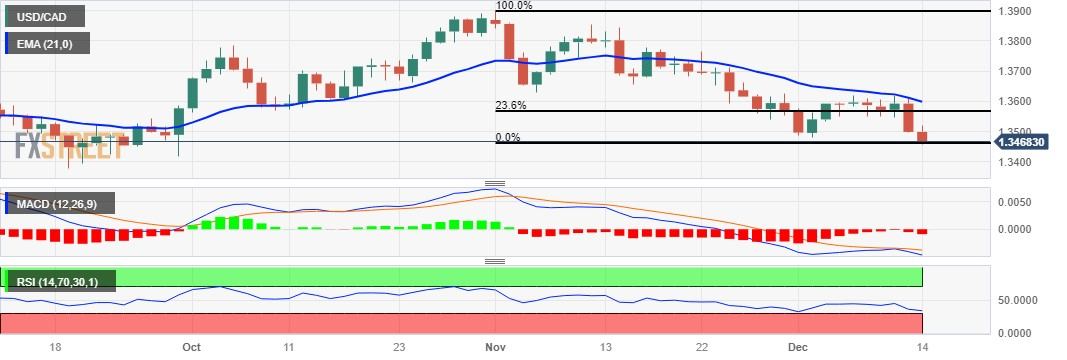
USD/CAD Price Analysis: Edges lower to 1.3470 amid dovish Fed outlook, rising Oil prices

- USD/CAD extends its losses on the subdued US Dollar after the dovish Fed decision.
- A drop below the 1.3400 psychological level could push the pair toward August’s low of 1.3378.
- A firm break above 1.3500 could lead to exploring the resistance region around the 23.6% Fibonacci retracement at 1.3565.
USD/CAD moves on a downward trajectory, pressured by the dovish stance of the US Federal Reserve’s Interest Rate Decision on Wednesday, aligning with widespread expectations. The USD/CAD pair trades lower near 1.3470 during the Asian session on Thursday.
The Federal Open Market Committee’s (FOMC) “Summary of Economic Projections” further intensifies the downward pressure, revealing a 50 basis points decline in the rate projection for 2024. The combination of these factors contributes to the bearish movement in the USD/CAD pair.
The upbeat Crude oil prices contribute support to underpinning the Canadian Dollar (CAD). The USD/CAD pair could further test the major support at the 1.3450 level.
The technical indicator Moving Average Convergence Divergence (MACD) for the USD/CAD pair is signaling a potential bearish trend. With the MACD line positioned below the centerline and exhibiting divergence below the signal line, the indication is that a further drop could lead the pair towards navigating the psychological region around the 1.3400 level, with the next support potentially found at August’s low of 1.3378.
The analysis adds another layer to the dovish sentiment for the USD/CAD pair, highlighting the 14-day Relative Strength Index (RSI) being below 50. This position of the RSI below 50 indicates a weakness in the pair, aligning with the broader bearish outlook.
On the upside, the USD/CAD pair encounters a significant psychological barrier at the 1.3500 level. A decisive breakthrough above this level could potentially ignite bullish momentum, prompting the USD/CAD pair to explore the region around the major resistance at 1.3550, followed by the 23.6% Fibonacci retracement at 1.3565.
If the pair manages to surpass these levels, the next target region would be the 21-day Exponential Moving Average (EMA) at 1.3599 and 1.3600 psychological levels.
