Gold pulls back after strong rally

- Gold price corrects after rallying after the release of US data that changed the outlook for interest rates, a key factor for Gold.
- The data revealed cooling inflation and flatlining spending, which suggests interest rates might fall.
- Lower interest rates are positive for Gold price and the pair is in an uptrend on the charts.
Gold price (XAU/USD) trades slightly lower in the $2,380s on Thursday after making significant gains on the previous day. Gold bulls flexed their muscles following the release of US inflation data that led to a recalibration of interest rate expectations, with implications for both the US Dollar (USD) and Gold price.
Gold stabilizes following rally after release of US data
Gold price is correcting back on Thursday amid profit taking after an over one percent rise on the previous day. The release of cooler US Consumer Price Index (CPI) data and Retail Sales for April led to a change in expectations for the future path of US interest rates, a key factor in Gold valuations.
The lower-than-expected CPI data reflected a disinflationary trend that brought forward the time when the Federal Reserve (Fed) is expected to make its long-awaited cut in interest rates. According to the CME FedWatch Tool, there is around 75% probability that the fed funds rate will be at lower levels after the September meeting. This is much higher than the 65% chance seen before the CPI release, according to FXStreet Editor Lallalit Srijandorn.
The expectation of lower interest rates is positive for Gold as it reduces the opportunity cost of holding the non-yielding asset vis-a-vis cash or bonds. Gold is further lifted by the loss of value of the US Dollar (USD) that attended the data, as like most commodities Gold is chiefly traded in US Dollars.
Still, the outlook for the precious metal remains positive against a backdrop of continued robust demand from central banks – in particular those in emerging markets – high levels of geopolitical risk and concerns regarding a fracturing of world trade along partisan lines.
Indeed, according to data from the World Gold Council (WGC), demand for Gold “rose by 3% to 1,238 tonnes, making it the strongest first quarter since 2016,” writes Srijandorn.
Technical Analysis: Gold price pulls back after strong rise
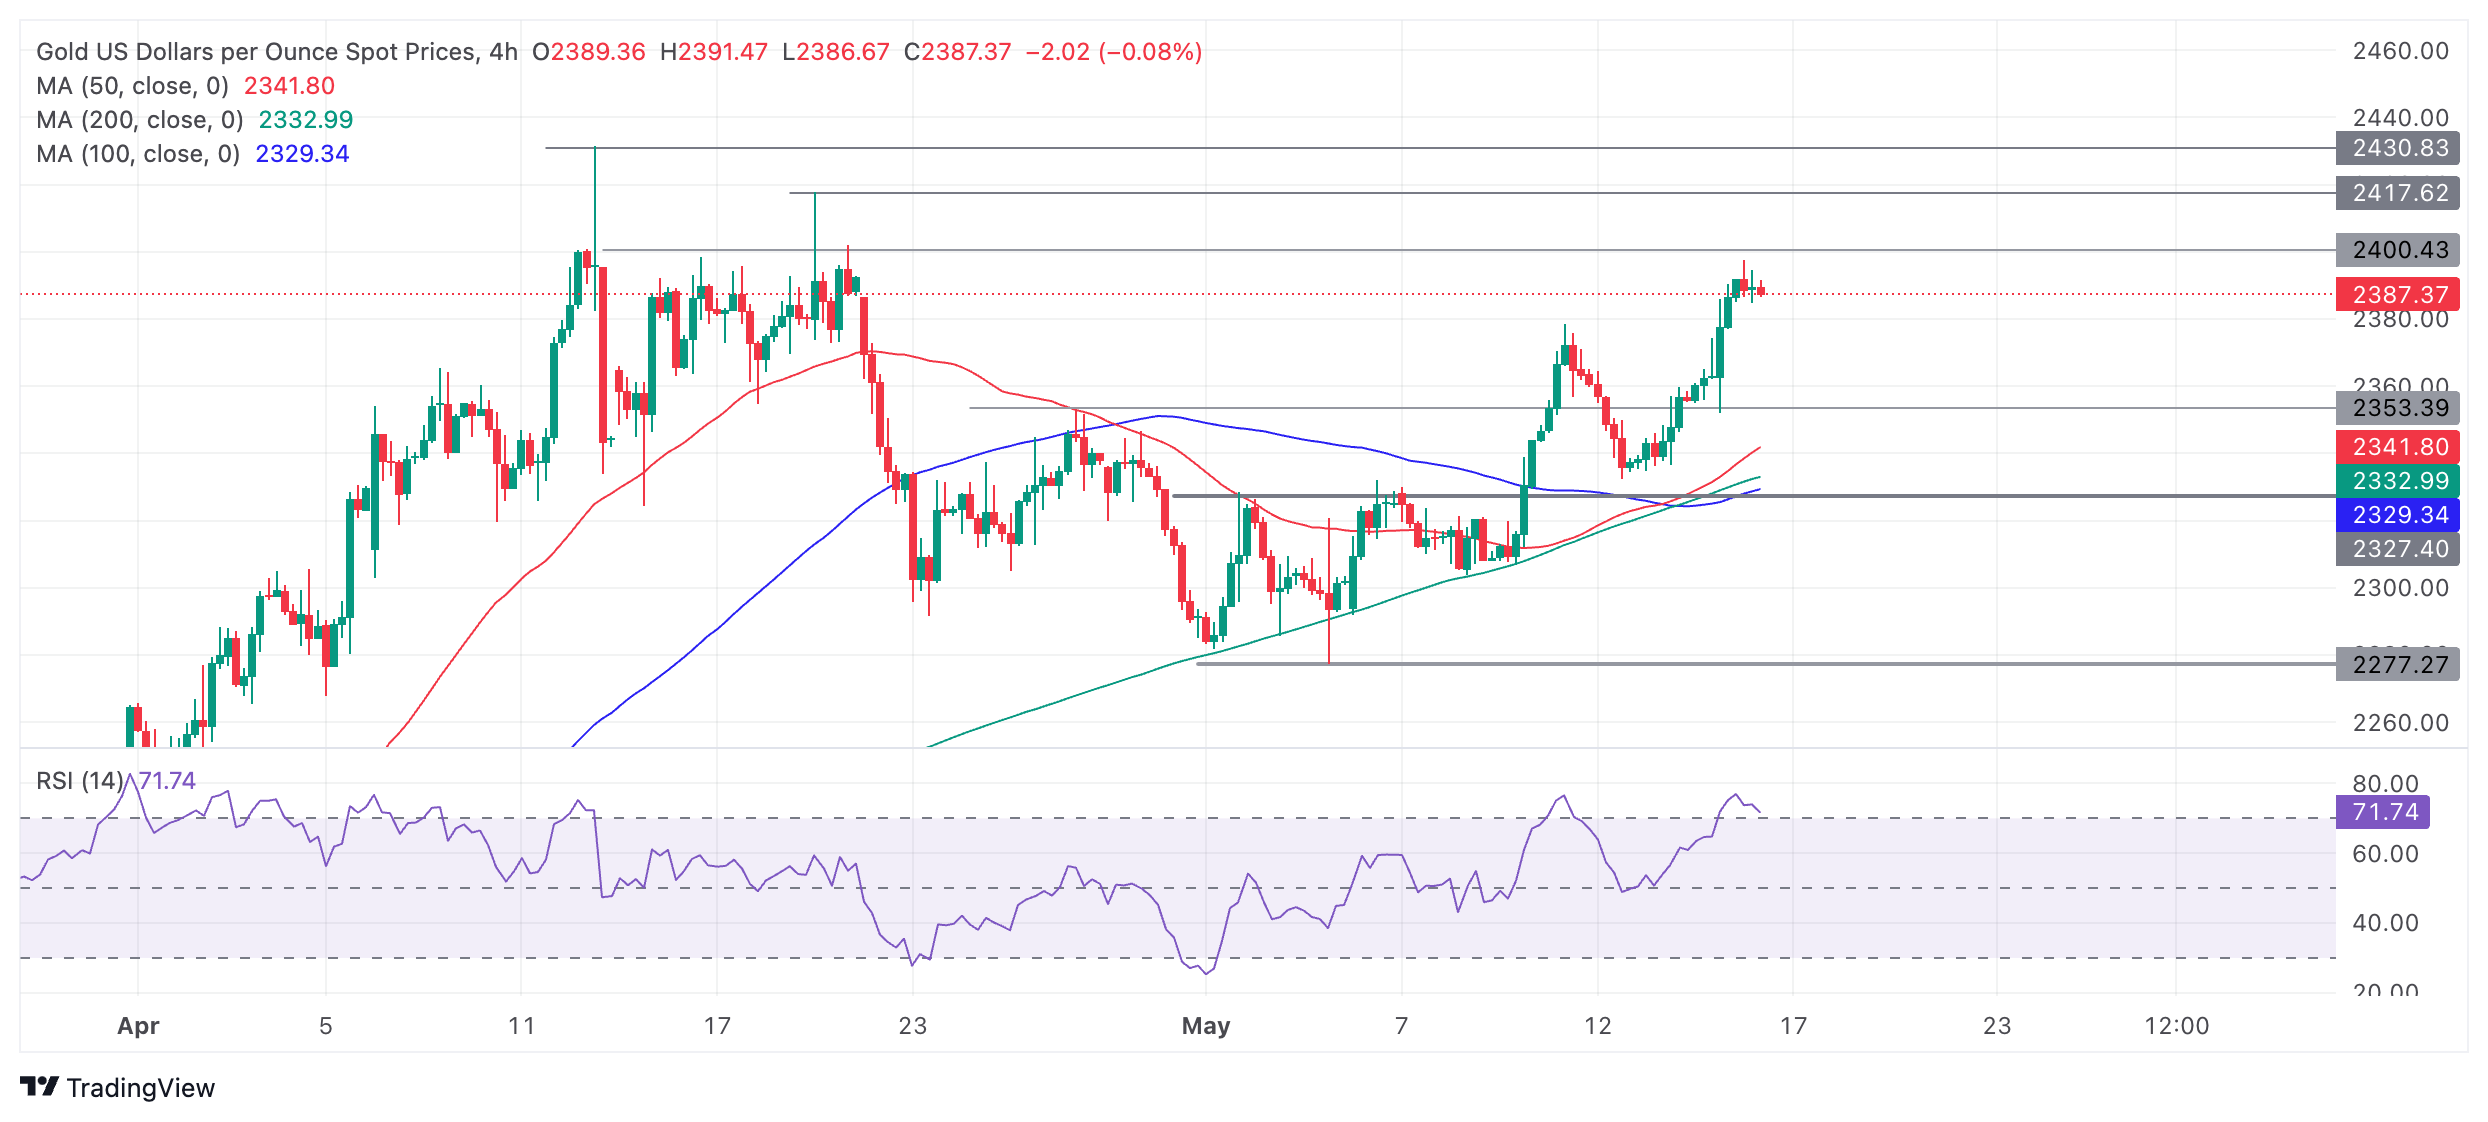
Gold price (XAU/USD) has pushed up to just shy of resistance at $2,400 as it extends its short-term uptrend higher.
XAU/USD 4-hour Chart
The Relative Strength Index (RSI) is in the overbought zone, cautioning traders not to add to their long positions as there is an increased chance of a pullback. If the RSI exits overbought it will signal a deeper correction is underway.
That said, the precious metal remains in an uptrend and, given the old saying “the trend is your friend,” Gold price is likely to continue trading with a bullish bias. A break above $2,400 would likely see it rally to the next resistance level at $2,417 (the April 19 high), followed by $2,430 – the all-time high.
The medium and long-term charts (daily and weekly) are also bullish, adding a supportive backdrop for Gold.
Economic Indicator
Consumer Price Index (YoY)
Inflationary or deflationary tendencies are measured by periodically summing the prices of a basket of representative goods and services and presenting the data as The Consumer Price Index (CPI). CPI data is compiled on a monthly basis and released by the US Department of Labor Statistics. The YoY reading compares the prices of goods in the reference month to the same month a year earlier.The CPI is a key indicator to measure inflation and changes in purchasing trends. Generally speaking, a high reading is seen as bullish for the US Dollar (USD), while a low reading is seen as bearish.
