USD/INR jumps ahead of US GDP data

- Indian Rupee weakens for the fourth consecutive day on Thursday.
- The USD demand from importers, India’s election-related risks and foreign outflows in Indian equities weigh on the INR.
- The US Gross Domestic Product (GDP) for Q1 2024 will be in the spotlight on Thursday.
Indian Rupee (INR) extends the decline on Thursday. The sell-off in the INR is pressured by the persistent US Dollar (USD) demand from importers and India’s election-related uncertainties. Furthermore, the foreign outflows in Indian equities contribute to the INR’s downside. Market players will closely monitor India’s weeks-long general elections, with the outcome set to be counted on June 4. Many analysts believe that the Indian Rupee could attract some buyers if Prime Minister Narendra Modi’s Bharatiya Janata Party (BJP) wins the election and continues pro-growth policies.
The second estimate of the US Gross Domestic Product (GDP) for Q1 2024 will be published on Thursday. On Friday, attention will shift to the US Core Personal Consumption Expenditures Price Index (Core PCE) for April and India’s GDP number for the March quarter of the last financial year (Q4 FY24).
Daily Digest Market Movers: Indian Rupee struggles to gain ground amid the multiple challenges
- The month-end USD purchases by oil importers had exacerbated the Indian rupee’s recent slide, said Sugandha Sachdeva, founder of SS WealthStreet, a New Delhi-based research firm.
- S&P Global Ratings retained India’s sovereign rating but raised its outlook from ‘stable’ to ‘positive’, highlighting the country’s robust economic fundamentals.
- Foreign investors have sold about $2.8 billion of Indian equities in May on a net basis so far, citing concerns about the upcoming election.
- Fed Atlanta President Bostic said on Thursday that the central bank “still has a ways to go” to curb the significant price growth seen over the last few years, according to Bloomberg.
- The US economic activity continued to expand at a “slight or modest” pace, and consumers pushed back against higher prices since early April, according to the Fed’s Beige Book released Wednesday.
- Investors have priced in 50% odds that the Fed will hold interest rates in September, according to the CME FedWatch Tool.
Technical analysis: USD/INR resumes its bullish outlook on the daily chart
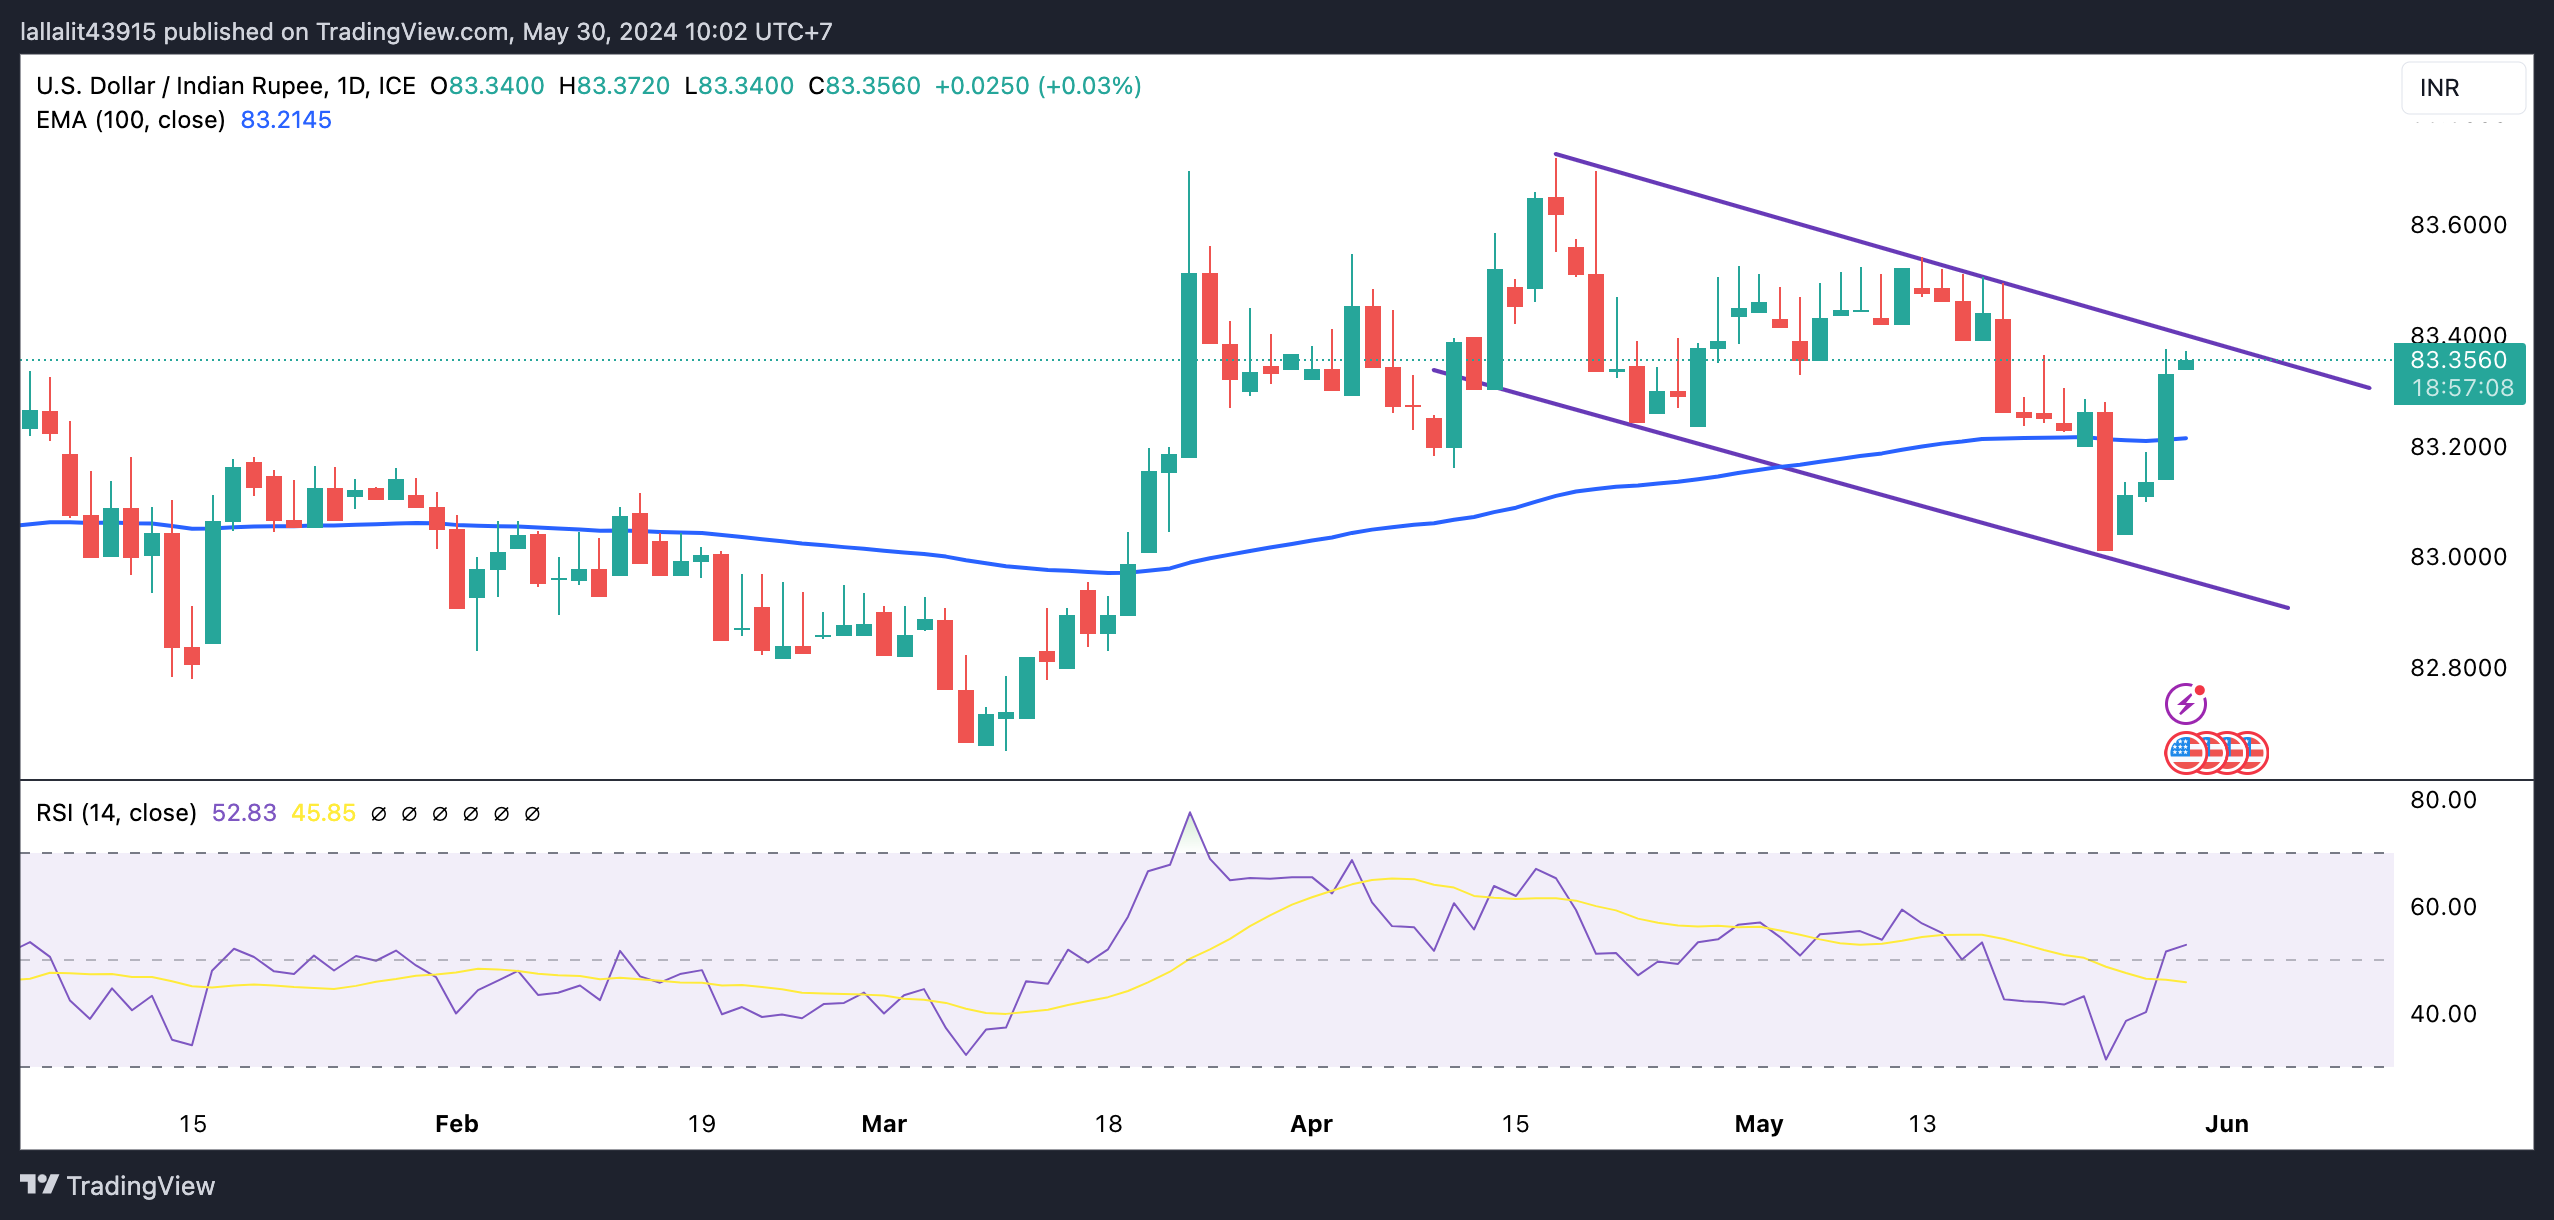
The Indian Rupee trades on a softer note on the day. The USD/INR pair turns bullish as it crosses above the key 100-day Exponential Moving Average (EMA) on the daily chart. The 14-day Relative Strength Index (RSI) bounces back to a bullish zone around 53.0, suggesting the support is likely to hold rather than break.
USD/INR has formed a descending trend channel since Mid-April. The upper boundary of the channel at 83.40 will be the first upside barrier for the pair. A decisive break above this level will expose a high of May 13 at 83.54 en route to a high of April 17 at 83.72, and finally the 84.00 figure.
In the bearish case, the 100-day EMA at 83.20 acts as an initial support level for the pair. The key contention level is seen at the 83.00 psychological mark. Extended losses could pave the way to a low of January 15 at 82.78, followed by a low of March 11 at 82.65.
US Dollar price this week
The table below shows the percentage change of US Dollar (USD) against listed major currencies this week. US Dollar was the strongest against the Euro.
| USD | EUR | GBP | CAD | AUD | JPY | NZD | CHF | |
| USD | 0.49% | 0.32% | 0.42% | 0.30% | 0.20% | 0.36% | -0.18% | |
| EUR | -0.49% | -0.15% | -0.07% | -0.19% | -0.30% | -0.12% | -0.68% | |
| GBP | -0.32% | 0.17% | 0.09% | -0.03% | -0.14% | 0.04% | -0.49% | |
| CAD | -0.42% | 0.04% | -0.11% | -0.14% | -0.24% | -0.06% | -0.63% | |
| AUD | -0.30% | 0.19% | 0.03% | 0.12% | -0.12% | 0.07% | -0.46% | |
| JPY | -0.19% | 0.30% | 0.14% | 0.23% | 0.09% | 0.17% | -0.37% | |
| NZD | -0.36% | 0.13% | -0.04% | 0.06% | -0.07% | -0.19% | -0.56% | |
| CHF | 0.18% | 0.65% | 0.50% | 0.60% | 0.46% | 0.34% | 0.54% |
The heat map shows percentage changes of major currencies against each other. The base currency is picked from the left column, while the quote currency is picked from the top row. For example, if you pick the Euro from the left column and move along the horizontal line to the Japanese Yen, the percentage change displayed in the box will represent EUR (base)/JPY (quote).
