CBA analysis and Elliott Wave forecast [Video]

CBA stock analysis and Elliott Wave technical forecast
Greetings,
Our Elliott Wave analysis today focuses on the Australian Stock Exchange (ASX) and the Commonwealth Bank of Australia (CBA). Currently, CBA is unfolding in wave 3 (grey) and subdividing into wave ((iii)) (navy), indicating potential for further gains. We are closely monitoring CBA for a long trade setup.
ASX: COMMONWEALTH BANK OF AUSTRALIA (CBA) Elliott Wave Technical Analysis.
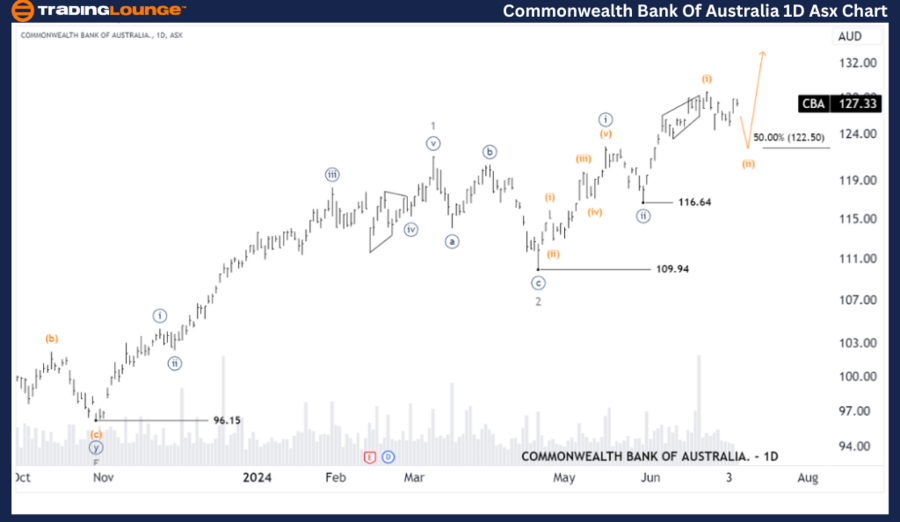
1-Day chart (Semilog Scale) analysis.
-
Function: Major trend (Minor degree, grey).
-
Mode: Motive.
-
Structure: Impulse.
-
Position: Wave (ii) (orange) of Wave ((iii)) (navy) of Wave 3 (grey).
Details:
CBA has completed wave (i) (orange) in a Diagonal form. Now, wave (ii) (orange) is expected to push lower with an immediate target around 122.50. We are watching for a long trade setup.
Invalidation point: 123.40.
ASX: COMMONWEALTH BANK OF AUSTRALIA (CBA) Elliott Wave Technical Analysis.
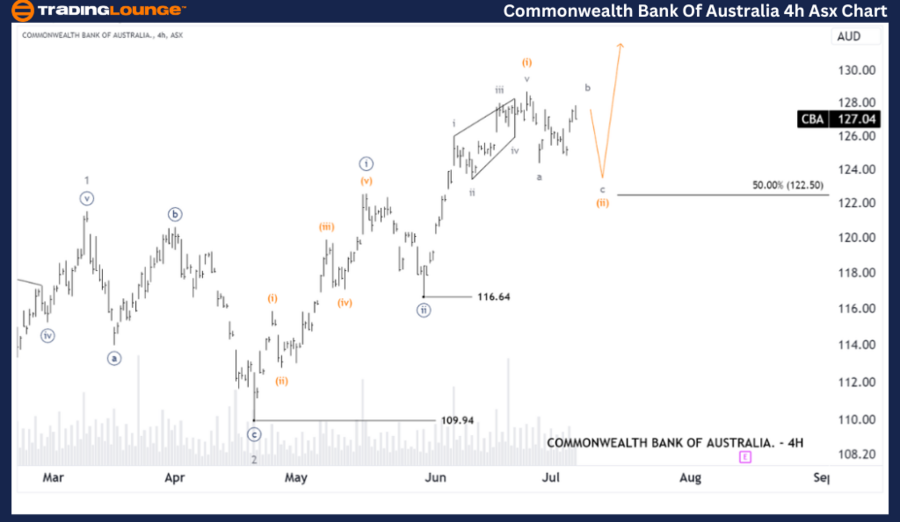
4-Hour chart analysis.
-
Function: Major trend (Minuette degree, orange).
-
Mode: Motive.
-
Structure: Impulse.
-
Position: Wave b (grey) of Wave (ii) (orange) of Wave ((iii)) (navy).
Details:
The short-term outlook shows wave (i) (orange) has ended, and wave (ii) (orange) is unfolding in a Zigzag pattern. Wave b (grey) is nearing completion, followed by wave c (grey), targeting around 122.50. Afterward, wave (ii) (orange) should complete, allowing wave (iii) (orange) to push higher.
Invalidation point: 116.64.
Conclusion
Our analysis provides insights into the current trends and strategies to capitalize on them. We highlight specific price points for validation or invalidation of our wave count, enhancing confidence in our forecast. This combination offers a professional and objective perspective on market trends.
Technical analyst:
Hua (Shane) Cuong, CEWA-M (Master’s Designation)

