Will cooling inflation in Canada help the BoC to go for another cut?

- The Canadian Consumer Price Index is seen losing further traction in July.
- The BoC could extend its easing cycle in the latter part of the year.
- The Canadian Dollar appears firm against its US counterpart so far in August.
Canada is poised to release the latest inflation figures on Tuesday, with Statistics Canada publishing the Consumer Price Index (CPI) data for July. Forecasts suggest the continuation of disinflationary trends in the headline CPI, while another uptick in the core reading, as it happened in June, could add some volatility to the release.
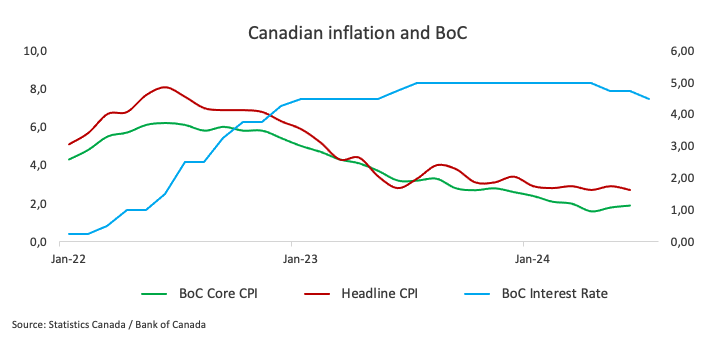
Alongside the CPI data, the Bank of Canada (BoC) will also unveil its core Consumer Price Index, which excludes volatile components like food and energy. In June, the BoC core CPI recorded a 0.1% drop against May’s reading and a 1.9% gain over the last twelve months, while the headline CPI climbed by 2.7% over the past year and contracted by 0.1% from the previous month.
These numbers are under close scrutiny, as they could impact the Canadian Dollar (CAD) in the short term and shape expectations for the Bank of Canada’s monetary policy, particularly after the central bank cut its policy rate by an extra 25 basis points (bps) to 4.50% in July.
In the FX world, the Canadian Dollar gathered strong traction following year-to-date lows near 1.3950 against the Greenback on August 5. So far, the downside in USD/CAD remains well guarded by the key 200-day SMA near 1.3600 the figure.
What can we expect from Canada’s inflation rate?
Analysts anticipate that price pressures in Canada will maintain their downward bias in July, though they are likely to still remain above the central bank’s target. Consumer prices are expected to follow the recent trend observed in the US, where lower-than-expected CPI data have fuelled speculation about a 50 bps interest rate cut by the Federal Reserve (Fed) in September. Despite those expectations fizzling out afterwards, along with strong results on the US macro data, the Fed is largely predicted to trim its interest rates by 25 bps next month.
Should the upcoming data meet these expectations, investors may speculate that the Bank of Canada (BoC) could further ease its monetary policy with another quarter-point interest rate cut, potentially bringing the policy rate down to 4.25% at its September 4 meeting.
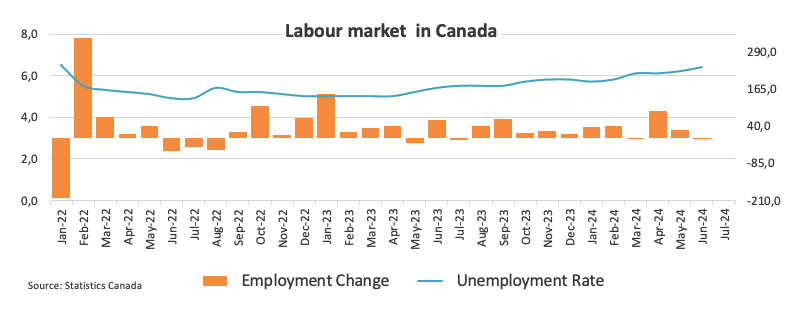
According to the Minutes of its July event, BoC governors expressed concerns about weaker consumer spending in 2025 and 2026 compared to expectations. Lower borrowing costs could boost spending, but households would still face debt-servicing burdens, hindering any recovery. Economic growth lags behind population growth, causing excess supply and labour market slack. This could weaken the labour market and dampen consumption, affecting growth and inflation.
Back to inflation, and following the interest rate cut last month, BoC’s Governor Tiff Macklem argued that the economy is experiencing excess supply, with slack in the labour market contributing to downward pressure on inflation. He noted that their assessment indicates sufficient excess supply already exists in the economy and emphasized that, rather than increasing excess supply, the focus should be on boosting growth and job creation to absorb this surplus and achieve a sustainable return to the 2% inflation target.”

Analysts at TD Securities commented that: “Markets will look to the July CPI for a final update on underlying price pressures ahead of the September BoC decision, with TD projecting a 0.2pp drop to 2.5% y/y, although stronger core inflation momentum should give a mixed tone to the report.”
When is the Canada CPI data due, and how could it affect USD/CAD?
On Tuesday at 12:30 GMT, Canada will release the Consumer Price Index (CPI) for July. The Canadian Dollar’s response will largely hinge on any shifts in expectations regarding the Bank of Canada’s (BoC) monetary policy. However, unless there are significant surprises in the data, the BoC is expected to maintain its current easing approach, somewhat mirroring the stance of other central banks like the Fed.
USD/CAD began the month trading with a strong bias and climbing to yearly highs around 1.3950. However, the Canadian currency managed to regain firm pace and dragged spot nearly three cents lower at the time of writing, pari passu with a strong corrective decline in the US Dollar (USD).
Pablo Piovano, Senior Analyst at FXStreet, suggests that USD/CAD appears well supported by the critical 200-day SMA around 1.3600. A breach of that level could spark further weakness to the next support of note at the March bottom of 1.3419 (March 8), prior to the weekly low of 1.3358 from January 31.
On the upside, Pablo adds, immediate resistance is found at the 2024 high of 1.3946 (August 5), ahead of the key milestone of 1.4000 (June 11).
Pablo also noted that significant increases in CAD volatility would likely depend on unexpected inflation data. If the CPI comes in below expectations, it could bolster the argument for another BoC interest rate cut at the upcoming meeting, leading to a rise in USD/CAD. On the other hand, if inflation exceeds expectations, the Canadian Dollar might see only modest support.
Economic Indicator
Consumer Price Index (YoY)
The Consumer Price Index (CPI), released by Statistics Canada on a monthly basis, represents changes in prices for Canadian consumers by comparing the cost of a fixed basket of goods and services. The YoY reading compares prices in the reference month to the same month a year earlier. Generally, a high reading is seen as bullish for the Canadian Dollar (CAD), while a low reading is seen as bearish.
Next release: Tue Aug 20, 2024 12:30
Frequency: Monthly
Consensus: 2.5%
Previous: 2.7%
Source: Statistics Canada
Canadian Dollar PRICE Today
The table below shows the percentage change of Canadian Dollar (CAD) against listed major currencies today. Canadian Dollar was the strongest against the US Dollar.
| USD | EUR | GBP | JPY | CAD | AUD | NZD | CHF | |
|---|---|---|---|---|---|---|---|---|
| USD | -0.51% | -0.36% | -0.70% | -0.33% | -0.92% | -1.07% | -0.33% | |
| EUR | 0.51% | 0.07% | -0.16% | 0.18% | -0.51% | -0.73% | 0.16% | |
| GBP | 0.36% | -0.07% | -0.38% | 0.08% | -0.58% | -0.73% | 0.09% | |
| JPY | 0.70% | 0.16% | 0.38% | 0.31% | -0.25% | -0.23% | 0.25% | |
| CAD | 0.33% | -0.18% | -0.08% | -0.31% | -0.62% | -0.66% | -0.02% | |
| AUD | 0.92% | 0.51% | 0.58% | 0.25% | 0.62% | -0.07% | 0.66% | |
| NZD | 1.07% | 0.73% | 0.73% | 0.23% | 0.66% | 0.07% | 0.77% | |
| CHF | 0.33% | -0.16% | -0.09% | -0.25% | 0.02% | -0.66% | -0.77% |
The heat map shows percentage changes of major currencies against each other. The base currency is picked from the left column, while the quote currency is picked from the top row. For example, if you pick the Canadian Dollar from the left column and move along the horizontal line to the US Dollar, the percentage change displayed in the box will represent CAD (base)/USD (quote).
