
Robinhood (HOOD : NASDAQ) rallied from blue box area
Robinhood Markets Inc. (HOOD : NASDAQ) is a California-based financial technology (fintech) company that operates an online discount brokerage with commission-free trading. In this article, we will analyze the technical structure based on the Elliott Wave Theory and highlight its potential growth.
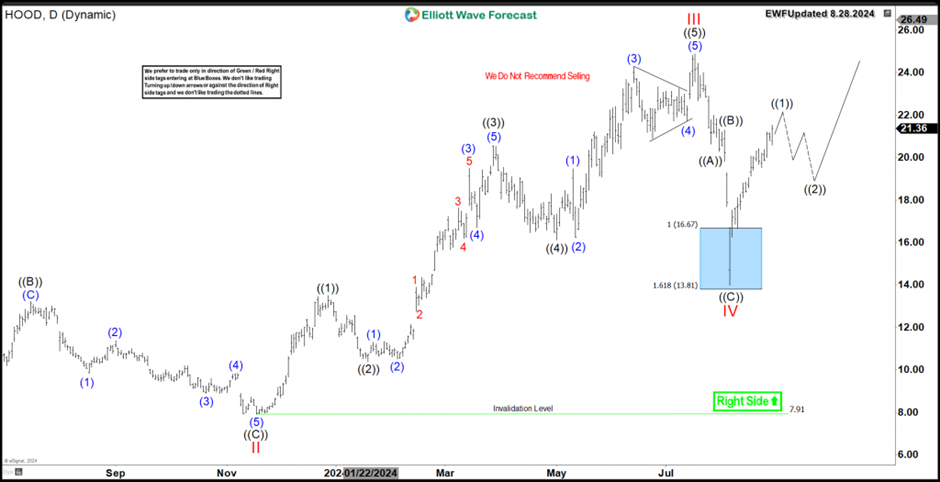
HOOD main cycle started in June 2022 establishing an impulsive structure to the upside. Wave I ended in November 2022 then the stock corrected lower in wave II until November 2023. Up from there, It rallied into 5 waves structure within wave III with a 200% increase in price. The stock peaked on July 2024 at $24.88 and then it dropped 44% within a corrective decline.
The move lower in wave IV unfolded as 3 waves ZigZag structure. HOOD reached our Blue Box area at equal legs $16.67 – $13.81 as presented on the daily chart. The blue box showing in our chart is a technical area where we expect the correction to end then a start of the next leg to the upside in a proposed wave V.
The Initial reaction from the lows is expected to be wave ((1)) of V. Consequently HOOD is expected to remain supported above August low $13.98. It will be looking to resume the daily rally looking for new highs with an initial target area at $27.5 – $31.6.