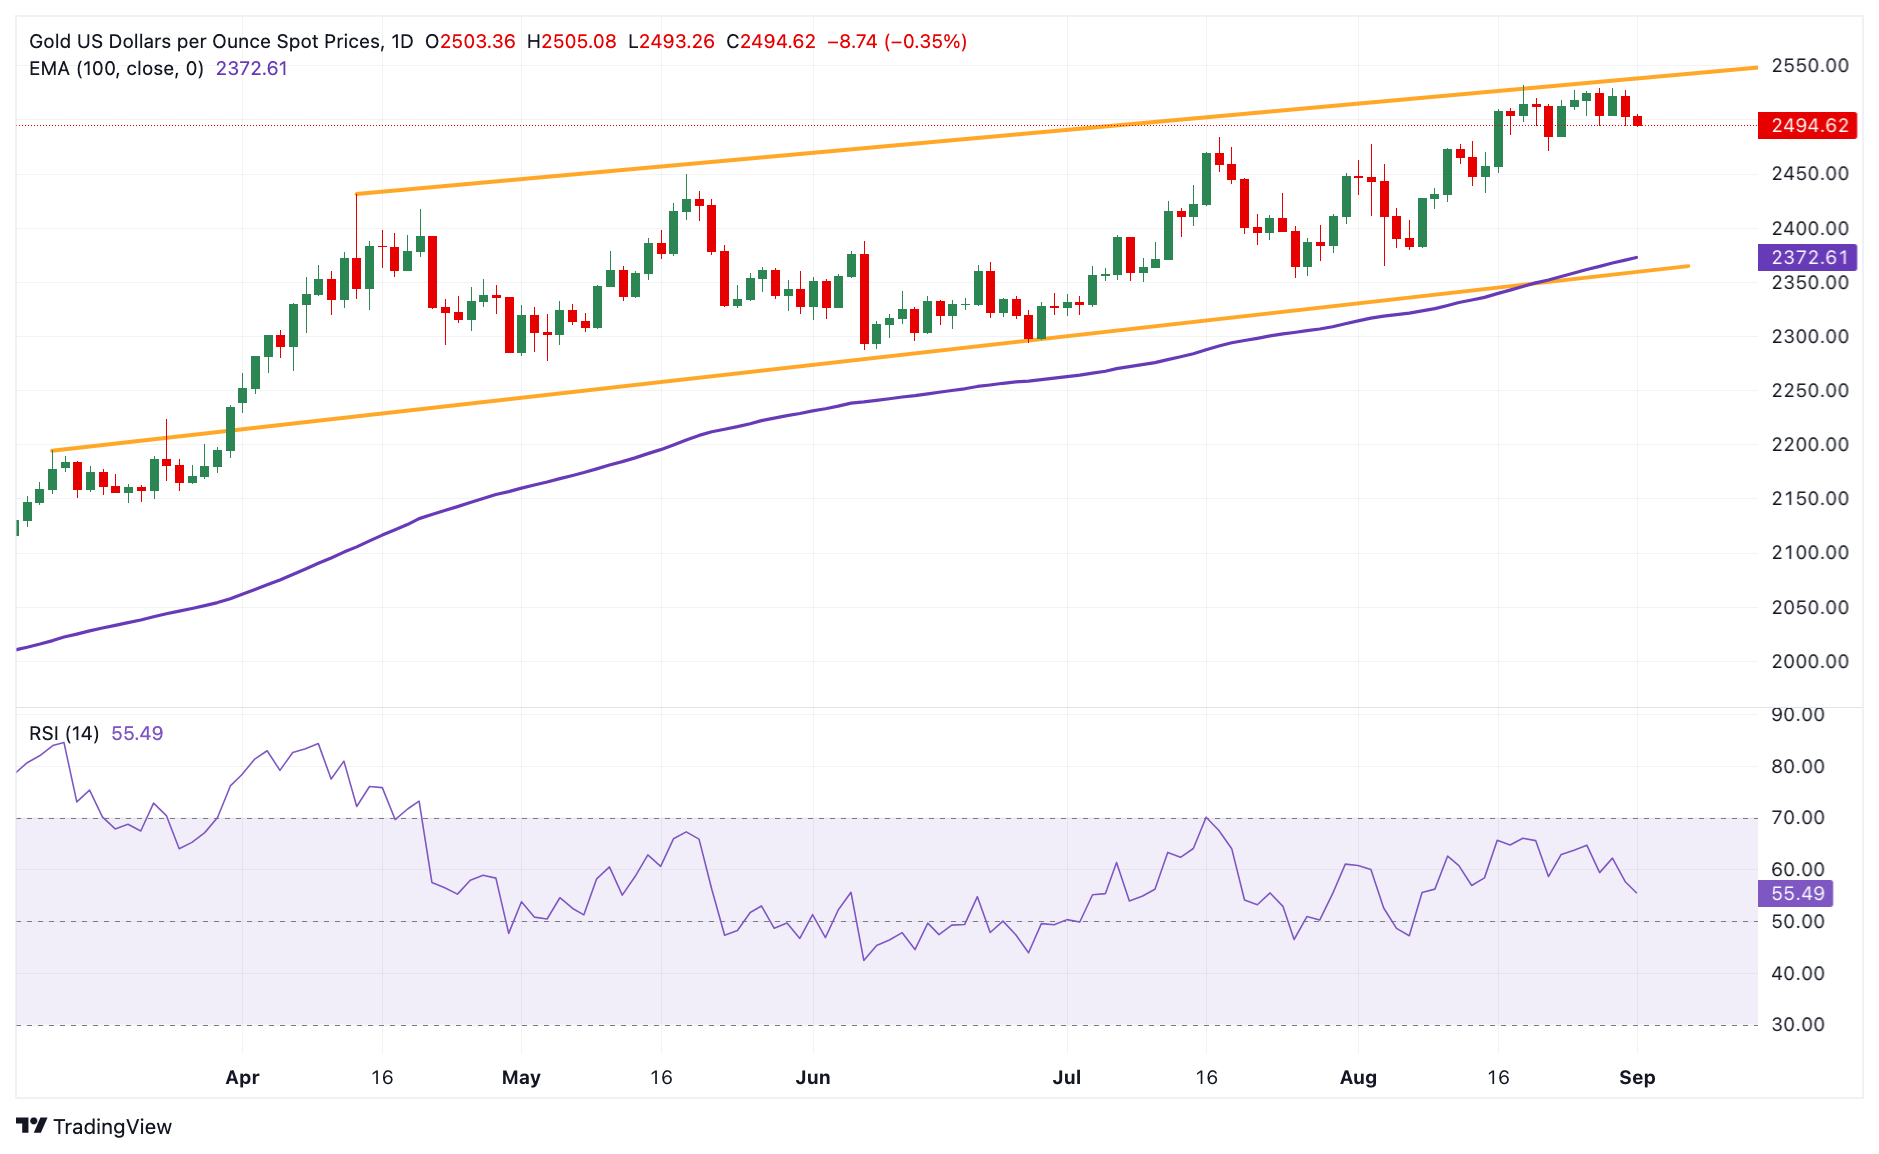
Gold drifts lower below $2,500 on stronger US Dollar

- Gold price loses traction in Monday’s Asian session.
- The stronger USD undermines the yellow metal, while the dovish Fed might cap its downside.
- Traders will focus on the US PMI data ahead of the employment report on Friday.
The Gold price (XAU/USD) extends its decline below the $2,500 psychological level on Monday. The firmer Greenback after the US July’s Personal Consumption Expenditures (PCE) Index has weighed on the precious metal. Furthermore, the concerns about the sluggish economy in China, the world’s top buyer of Gold, contribute to the precious metal’s downside.
Nonetheless, the rising expectation of an interest rate cut by the US Federal Reserve (Fed) in its September meeting might help limit Gold’s losses as lower interest rates reduce the opportunity cost of holding non-yielding gold. Looking ahead, the US ISM Manufacturing PMI for August is due on Tuesday, while the Services PMI will be released on Thursday. The attention will shift to the US employment data on Friday, including the Nonfarm Payrolls (NFP), Unemployment Rate and Average Hourly Earnings for August.
Daily Digest Market Movers: Gold price retreats after US PCE inflation report
- Protests have broken out across Israel after the country’s military recovered the bodies of six hostages it said Hamas had killed in Gaza. Israel’s largest labor group has called for a strike, saying the “entire Israeli economy will shut down” Monday, per CNN.
- Chinese NBS Manufacturing Purchasing Managers’ Index (PMI) declined to 49.1 in August from 49.54 in July, missing the market consensus of 49.5. Non-Manufacturing PMI rose to 50.3 in August versus 50.2 prior, better than the estimates of 50.0.
- Data released by the US Bureau of Economic Analysis on Friday showed that the US headline Personal Consumption Expenditures (PCE) Price Index rose 2.5% YoY in July, compared to the previous reading of 2.5%, softer than the market expectations of 2.6%.
- The core PCE, which strips out volatile food and energy prices, climbed 2.6% YoY in July versus 2.6% prior, below the consensus of 2.7%.
- The markets are now pricing in a nearly 70% of 25 basis points (bps) rate cut by the Fed in September, while the odds of a 50 bps reduction are standing at 30%, according to the CME FedWatch tool.
Technical Analysis: Gold price maintains the constructive broader picture
The Gold price trades in negative territory on the day. The precious metal keeps the broader bullish context on the daily timeframe as the price holds above the key 100-day Exponential Moving Average (EMA). The 14-day Relative Strength Index (RSI) positions above the midline around 56.30, suggesting the path of least resistance is to the upside.
A five-month-old ascending channel’s upper boundary and the all-time high of $2,530-$2,540 appear to be a tough nut to crack for Gold bulls. A bullish breakout above this level could pave the way to the $2,600 psychological mark.
On the downside, the first downside target for yellow metal emerges at $2,470, the low of August 22. Sustained bearish momentum could set off a prolonged downward towards $2,432, the low of August 15. The next contention level to watch is $2,372, the 100-day EMA.
US Dollar price this week
The table below shows the percentage change of US Dollar (USD) against listed major currencies this week. US Dollar was the strongest against the New Zealand Dollar.
| USD | EUR | GBP | CAD | AUD | JPY | NZD | CHF | |
| USD | -0.03% | 0.01% | 0.05% | 0.10% | -0.31% | 0.22% | -0.10% | |
| EUR | 0.03% | 0.06% | 0.08% | 0.15% | -0.29% | 0.24% | -0.06% | |
| GBP | -0.01% | -0.06% | 0.03% | 0.06% | -0.34% | 0.20% | -0.12% | |
| CAD | -0.07% | -0.09% | -0.03% | 0.04% | -0.37% | 0.16% | -0.14% | |
| AUD | -0.07% | -0.12% | -0.07% | -0.02% | -0.44% | 0.12% | -0.16% | |
| JPY | 0.32% | 0.29% | 0.34% | 0.40% | 0.40% | 0.53% | 0.22% | |
| NZD | -0.22% | -0.25% | -0.19% | -0.17% | -0.10% | -0.54% | -0.31% | |
| CHF | 0.10% | 0.07% | 0.12% | 0.15% | 0.18% | -0.22% | 0.31% |
The heat map shows percentage changes of major currencies against each other. The base currency is picked from the left column, while the quote currency is picked from the top row. For example, if you pick the Euro from the left column and move along the horizontal line to the Japanese Yen, the percentage change displayed in the box will represent EUR (base)/JPY (quote).
