
Gold Miners ETF (GDX) should continue to extend higher [Video]
Short Term Elliott Wave in Gold Miners Junior (GDX) suggests rally from 11.10.2023 low is in progress as a 5 waves impulse. Up from 11.10.2023 low, wave ((i)) ended at 29.07 as the 1 hour chart below shows. Dips in wave (ii) unfolded as a zigzag Elliott Wave structure. Down from wave ((i)), wave (a) ended at 28.38 and wave (b) rally ended at 28.75. Wave (c) lower ended at 27.98 which completed wave ((ii)) in higher degree.
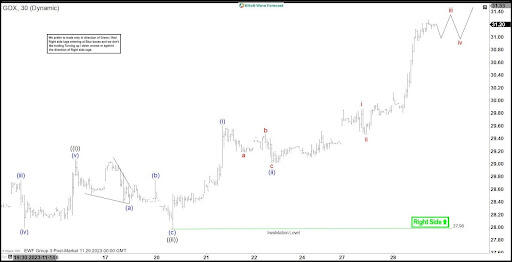
The ETF then extends higher in wave ((iii)). Up from wave ((ii)), wave (i) ended at 29.6. Wave (ii) ended as a zigzag structure in lesser degree. Down from wave (i), wave a ended at 29.18, wave b ended at 29.47, and wave c ended at 29.01. This completed wave (ii) in higher degree. The ETF then extends higher again in wave (iii). Up from wave (ii), wave i ended at 29.87 and pullback in wave ii ended at 29.46. Expect the ETF to rally a bit higher to end wave iii, then it should pullback in wave iv to correct cycle from 11.28.2023 low before it resumes higher. Near term, as far as pivot at 27.98 low stays intact, expect dips to find support in 3 ,7, or 11 swing for further upside.